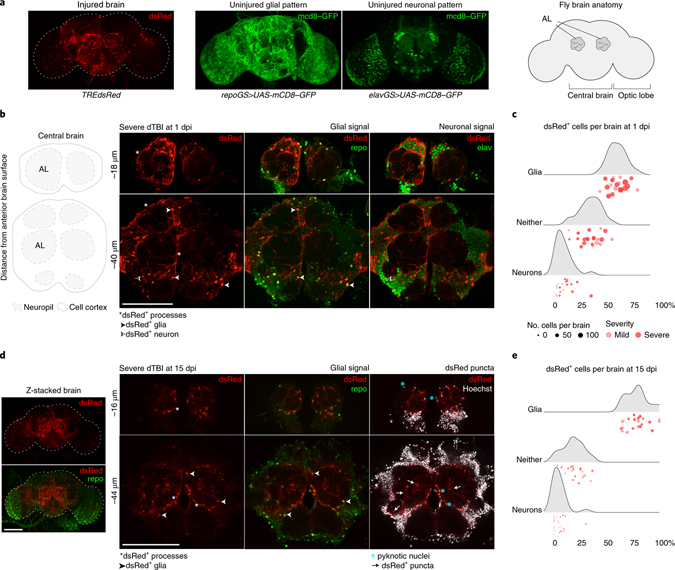
Fig. 3 |. AP1 activates and persists in glia.
a, Representative z-stacked whole-mount brain showing dsRed pattern in an injured brain (severe dTBI, 1 dpi). Also shown are the pattern of glial and neural membranes in uninjured brains, highlighted using a membrane-targeted GFP variant (mcd8-GFP) expressed under an inducible glial (repoGS aka repoGeneSwitch) or neural-specific (elavGS aka elavGeneSwitch) promoter. Simplified anatomy of the fly brain on the right, as seen in whole mount brain images. b, Representative high-magnification images of the central brain at 1 dpi. Thick, hypertrophic dsRed+ membrane processes are detected throughout the brain. Many dsRed+ cells co-localize with a nuclear glia-specific antibody (repo). c, Ridgeline plot demonstrating the proportion of dsRed+ cells that are glia (repo+), neurons (elav+) or neither (repo−/elav−) in mild (pink) and severe (red) dTBI brains (each point = 1 brain). X-axis indicates the percentage of all dsRed+ cells. Y-axis indicates sample density along the x-axis. d, Representative high-magnification images of the central brain at 15 dpi. dsRed+ processes are thinner and appear fragmented (white arrowheads). dsRed+ repo+ nuclei appear shrunken (blue *). dsRed+ puncta are abundant throughout the neuropil (white arrows). On the left is the whole z-stacked brain, demonstrating the overall pattern of dsRed in late dTBI. e, Ridgeline plot as in c for 15 dpi dTBI brains. All scale bars 100μm.

