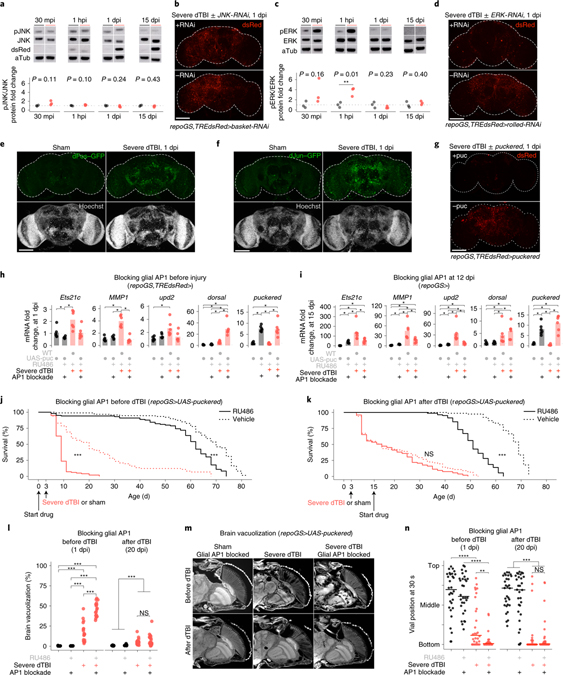
Fig. 4 |. Glial AP1 is activated by ERK and promotes early TBI recovery.
a, Representative protein changes (top) and quantification of pJNK/JNK by western immunoblot (each point = 1 biological replicate (8 brains); n = 3 biological replicates/condition; Student’s t-test for each timepoint). See Extended Data Fig. 3d for immunoblots. b, Endogenous dsRed protein in whole mount brains at 1 dpi, with (top) or without (bottom) glial JNK-RNAi. See Extended Data Fig. 3e for quantification. c, Representative immunoblot (top) and quantification of pERK/ERK (each point = 1 biological replicate (8 brains); n = 3 biological replicates/condition; Student’s t-test for each timepoint). See Extended Data Fig. 4b for immunoblots. d, dsRed protein in whole mount brains at 1 dpi, with (top) or without (bottom) glial ERK-RNAi (representative of n = 7–9 brains per condition). e, Whole mount of dFos-GFP flies. Representative of n = 9–16 brains per condition. f, Whole mount of dJun-GFP flies. Representative of n = 8–13 brains per condition. g, Representative brains at 1 dpi, with (top) or without (bottom) glial puckered upregulation. See Extended Data Fig. 4c for quantification. h, Mean relative expression of AP1 target genes by RT-qPCR at 1 dpi, with or without glial AP1 blocked (WT is w1118; each point = 1 biological replicate, 9 brains; n = 6 biological replicates per condition; Kruskal–Wallis test with Dunn’s test). i, Mean relative expression of AP1 target genes by RT-qPCR at 15 dpi, with or without glial AP1 blocked from 12 dpi (WT is w1118; each point = 1 biological replicate, 9 brains; n = 6 biological replicates/condition; Kruskal–Wallis test with Dunn’s test). j, Post-injury survival with (RU; solid line) or without (vehicle; dashed line) glial AP1 blocked before dTBI (n = 100 per condition, 5 vials of 20 flies; Kaplan-Meier analysis with log-rank comparison). k, Post-injury survival with (RU; solid line) or without (vehicle; dashed line) glial AP1 blocked from 12 dpi (n = 100 per condition, 5 vials of 20 flies; Kaplan-Meier analysis with log-rank comparison). l, Total brain area vacuolized when glial AP1 is blocked before dTBI (left; measured at 1 dpi; interaction p = 4.67e-10, two-way ANOVA with Tukey’s test) or from 12 dpi (right; measured at 20 dpi; interaction p = 0.45, two-way ANOVA with Tukey’s test). Each point = 1 brain; n = 15–18 brains per condition from two independent experiments. m, Representative paraffin sections for brain vacuolization corresponding to 4l. n, Locomotor activity with glial AP1 blocked before (left; 1 dpi; interaction p = 0.028, two-way ANOVA with Tukey’s test) or after dTBI (right; 20 dpi; interaction p = 0.49). Vial height 8 cm; each point = 1 animal; n = 30 animals/condition, from 3 independent experiments. a,c,h-l, and n: black sham, red severe dTBI. Statistical annotations ****p<0.0001, ***p<0.001, **p<0.01, *p<0.05. All statistical tests were two-sided where applicable. Full statistical reporting in Source Data Fig. 4. All scale bars 100μm.

