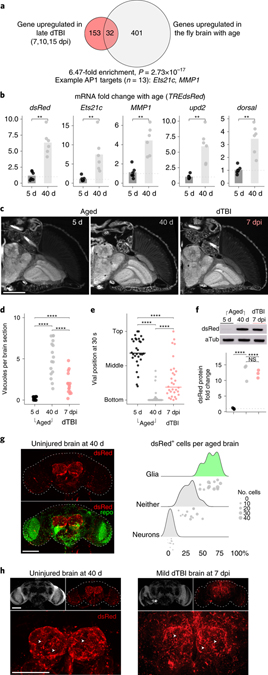
Fig. 5 |. Age and injury evoke a glial AP1 response.
a, Enrichment of genes upregulated in late dTBI (severe) and with age (0 vs 40 d male) in the fly brain (one-sided Fisher’s exact test). 40% of overlapping genes (13/32) are predicted AP1 targets. b, Mean relative expression of select AP1 target genes mRNA by RT-qPCR in 5 vs 40 d old brains (each point = 1 biological replicate, 9 brains; n = 6 biological replicates per condition; Wilcoxon test and Holm adjustment for each gene). c, Representative paraffin sections showing brain vacuolization in young (5 d), aged (40 d) and injured (7 dpi, mild dTBI) TREdsRed flies. d, Quantification for (c) showing the average number of vacuoles per brain section in young (black), aged (grey) and injured (pink) TREdsRed flies (p = 1.95e-8, Kruskal-Wallis test with Wilcoxon test and Holm adjustment). Each point = 1 animal measured across 5 non-consecutive 2 μm sections. e, Locomotor activity of young, aged, and injured TREdsRed flies (p = 2e-16; one-way ANOVA with Tukey’s test; n = 30 animals per condition, examined over 3 independent experiments). f, Representative protein changes (top) and quantification of dsRed by western immunoblot in TREdsRed flies (each point = 1 biological replicate, 8 brains; p = 2.59e-4; one-way ANOVA with Tukey’s test). d-f, Black symbols, 5 d uninjured; grey symbols, 40 d uninjured; pink symbols, 7 dpi mild dTBI. g, Left, representative z-stacked wholemount uninjured 40 d brain. Right, ridgeline plot, as shown in Figs 3c and 3e, for 40 d brains (each point = 1 brain). h, Representative z-stacked whole mount brains in age (left) and dTBI (right). Not shown is dsRed signal in 5 d uninjured brains, which is identical to shams at 1 dpi (see Fig. 2b). White arrowheads highlight dsRed+ puncta. Statistical annotations are ****p<0.0001, ***p<0.001, **p<0.01, *p<0.05. All statistical tests were two-sided where applicable. For full statistical reporting, including exact p-values, see Source Data Fig. 5. All scale bars 100μm.

