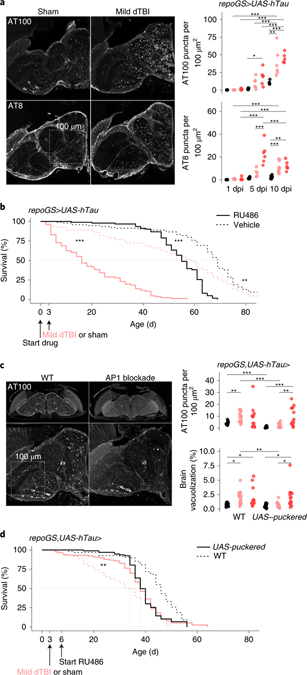
Fig. 6 |. Chronic AP1 activity promotes human tau pathology.
a, Left, representative hemisection of paraffin-embedded heads at 10 dpi, immunostained for tau phosphorylation sites AT100 and AT8. Box illustrates area of 1002 μm2. Right, quantification of the number of AT100+ and AT8+ puncta, represented as puncta per 100 μm2 at 1, 5 and 10 dpi (each point = 1 brain, n = 6 per condition/time pooled from two independent experiments; AT8: p = 6.40e-05, AT100: p=0.000336, two-way ANOVA with Tukey’s test). Black = sham, pink = mild dTBI and red = severe dTBI. b, Post-injury survival with (RU; solid) or without (vehicle; dashed) human tau expression in glia (n = 100 per condition, 5 vials of 20 flies; p < 0.0001, Kaplan-Meier analysis with log-rank comparison). c, Left, representative z-stacked hemisections of paraffin-embedded in WT (left; w1118) or AP1 blocked (right) mild dTBI at 10 dpi, immunostained for AT100. Right, quantification of AT100+ as in 6a (top) and % brain vacuolization (bottom) at 10 dpi without puckered (WT; w1118) or with puckered expression in glia from 3 dpi (each point = 1 brain, n = 12–16 per condition/genotype pooled from two independent experiments; AT100: p=0.0093, brain vacuolization: p=0.068, two-way ANOVA with Tukey’s test). Black = sham, pink = mild dTBI and red = severe dTBI. d, Post-injury survival with (solid) or without (dashed) added puckered expression in glia in the setting of tau expression (n = 100 per condition, 5 vials of 20 flies; p < 0.0001, Kaplan-Meier analysis with log-rank comparison). Statistical annotations are ****p<0.0001, ***p<0.001, **p<0.01, *p<0.05. All statistical tests were two-sided where applicable. For full statistical reporting with exact p-values, see Source Data Fig. 6. All scale bars 100μm. Color code for injury in a and c.

