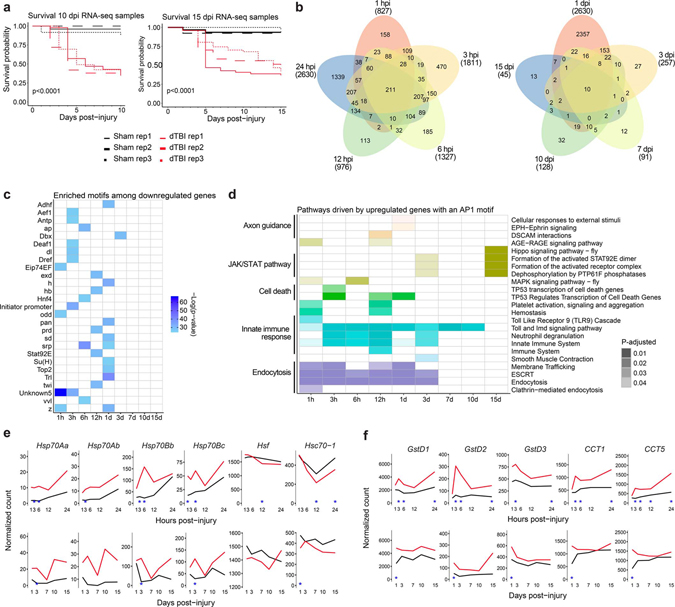
Extended Data Fig 1 |. A lasting AP1 transcriptional response to TBI.
a, Kaplan-Meier survival curve for 10 and 15 dpi RNAseq replicates. b, Venn diagram showing the number of common and distinct differentially expressed genes (FDR<0.05) between post-injury times. Value in parenthesis shows total (up and down) number of DE genes for a given timepoint. c, Results for HOMER de novo motif enrichment among downregulated genes (FDR<0.05). d, Tile plot showing Reactome pathways enriched among upregulated genes with a predicted AP1 motif (FDR<0.05). Presence of a colored tile indicates enrichment at a given post-injury time. Tile opacity encodes significance. Color corresponds to the parent process, as defined by the Reactome annotation database (annotated on left). e, Average sham (black) and severe dTBI (red) expression of genes related to the heat shock response at ≤1 dpi (top) and ≥1 dpi (bottom; blue star indicates FDR < 0.05 at a given time). f, Average sham (black) and severe dTBI (red) expression of canonical stress response genes at ≤1 dpi (top) and ≥1 dpi (bottom; blue star indicates FDR < 0.05 at a given time). See Supplementary Table 1 for genotypes.

