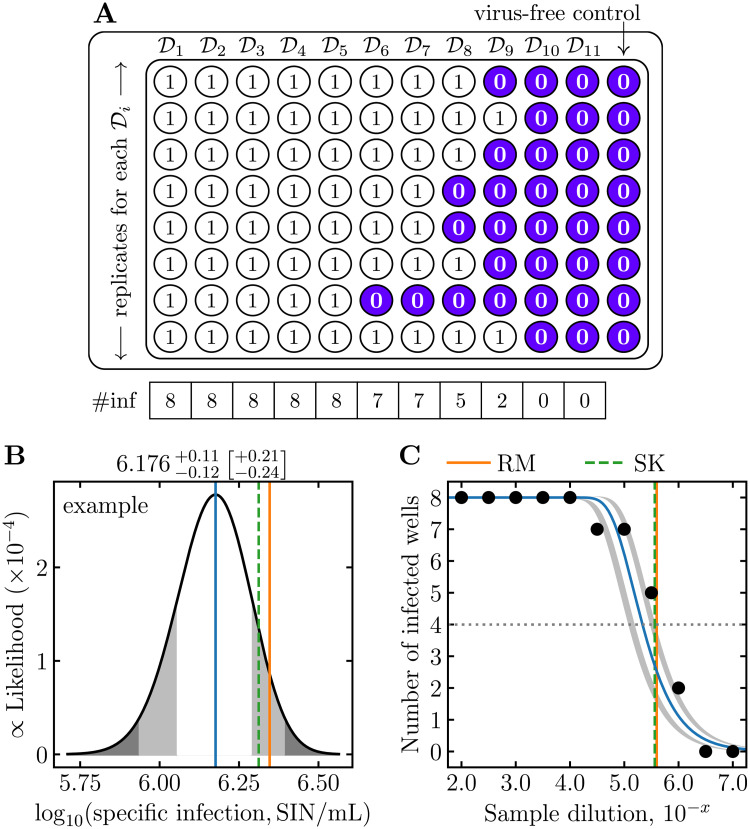
Fig 1. Visual representation of midSIN’s output for the example ED plate.
A: Illustration of the example ED plate where are the chosen serial dilutions of the sample. For the example described in the text, , , …, , with 8 replicates per dilution. The number of infected wells (# inf) is indicated at the bottom of each dilution column. B: The midSIN-estimated posterior distribution of the log10 infection concentration, log10(SIN/mL), for the example ED experiment. The vertical lines correspond to log10(SIN/mL), based on the most likely value (mode) of midSIN’s posterior distribution (solid blue), or computed from the RM (solid orange) and SK (dashed green) approximations of the log10(TCID50) (see Methods). The x-value of the white and light grey region on either sides of the mode indicate the edges of the 68% and 95% credible interval (CI), respectively. The midSIN-estimated log10(SIN/mL) mode ± 68% [±95%] CI are indicated numerically above the graph. C: The number of infected wells (black circles) out of the 8 replicates, as a function of the 11 serial dilutions of the example ED plate, from the least (leftmost) to the most (rightmost) diluted. For example, x = 3.0 corresponds to a sample dilution of 10−3 or 1/1,000. The average (expected) number of infected wells, as a function of sample dilution, is shown for the most likely value of log10(SIN/mL) (blue curve) or its 68% and 95% CI (inner and outer edge of the grey bands, respectively). The sample dilution (x-value) at which the blue curve crosses the horizontal dotted line (50% infected wells) corresponds to a concentration of 1 TCID50 per ED well volume. The vertical lines indicate the sample dilution that yields a concentration of 1 TCID50 according to the RM and SK approximations.

