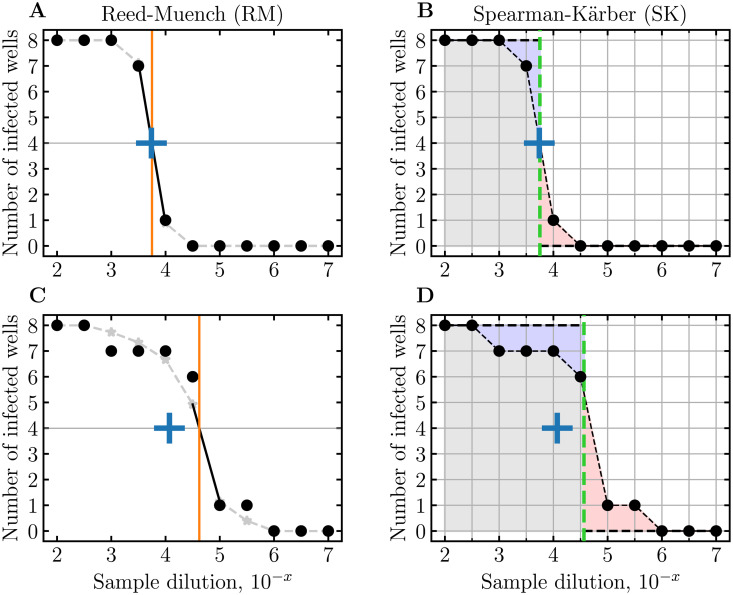
Fig 4. Visualizing TCID50 estimation by the RM and SK methods.
A,C: The RM method first smooths the data by taking the cumulative sum of the number of infected wells from the highest to the lowest dilution, and that of uninfected wells from the lowest to the highest dilution (grey dashed curve). It then identifies the dilution (vertical solid orange line) corresponding to the smooth curve’s 50% crossing point (4/8 wells, horizontal grey line) based on the highest dilution with > 50% wells infected, and the lowest dilution with < 50% wells infected. B,D: The SK method identifies the dilution (vertical dashed green line) such that the area under the curve to its right (pale red) would exactly fill the area over the curve to its left (pale blue). The agreement between the true TCID50 (blue plus) and the RM and SK estimates is good for the symmetric ED plate outcome in (A,B), but poor for the more irregular outcome in (C,D).

