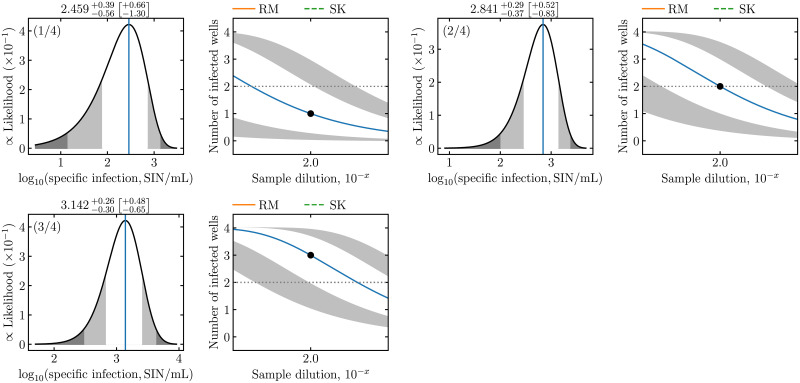
Fig 5. midSIN’s estimate of a sample’s infection concentration based on a single dilution.
Simulated example of an ED plate with an inoculation volume of Vinoc = 0.1 mL. Instead of serial dilutions, a single dilution () is used, and either 1, 2 or 3 well(s) out of the 4 replicate wells are infected. As the fraction of infected wells increases, the uncertainty on the estimate (68% and 95% CIs) decreases, and the posterior distribution becomes more symmetric (Normal-like). Other features are as explained in the caption of Fig 1. The RM and SK methods cannot provide an estimate for these outcomes.

