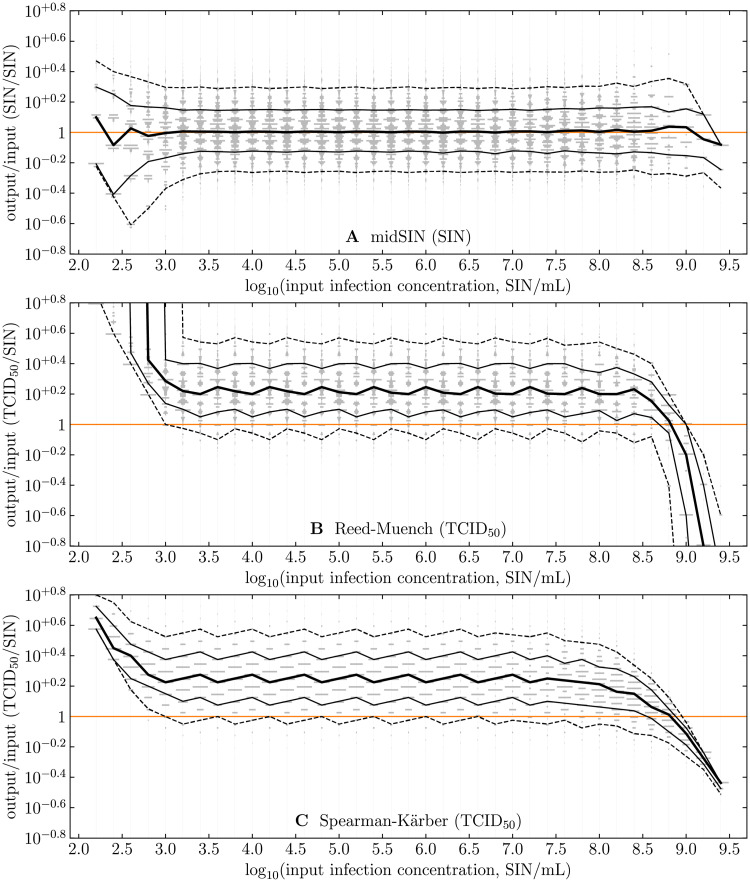
Fig 6. Comparing known input to estimated output concentrations.
For each input concentration between 102.2 and 109.4, one million random ED experiment outcomes (# of positive wells in each dilution column) were generated. For each ED outcome, either A: midSIN was used to determine the most likely log10(SIN/mL); or the B: RM or C: SK method was used to estimate the log10(TCID50/mL). Vertically stacked grey bands at each input concentration are sideways histograms, proportional to the number of ED outcomes that yield a given y-axis value. The black curves join the median (thick), 68th (thin) and 95th (dashed) percentile of the histograms, determined at (but not between) each input concentration. A plate layout of 11 dilutions, with 8 replicates per dilution, an inoculum volume of Vinoc = 0.1 mL, serial dilutions from to , separated by a dilution factor of 10−0.6 ≈ 1/4 were used in the simulated ED experiments.

