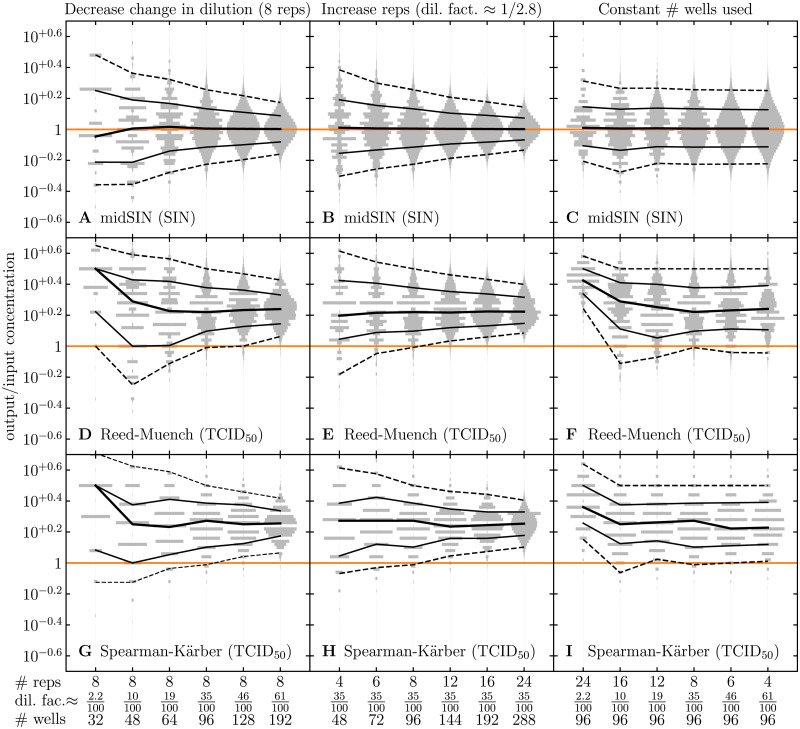
Fig 7. Comparing the effect of the dilution factor and number of replicates per dilution.
The effect of either A,D,G: decreasing the change in dilution (from a dilution factor of 2.2/100 to 61/100) while keeping 8 replicates per dilution; or B,E,H: increasing the number of replicates per dilutions (4 to 24) while keeping a fixed dilution factor (≈ 35/100); or C,F,I: increasing the dilution factor while decreasing the number of replicates, keeping a fixed number of 96 wells used in total to titer one virus sample. Different rows represent the ratio of the estimated output concentration using (A–C) midSIN in SIN/mL, (D–F) RM or (G–I) SK in TCID50/mL, and the input concentration. In all cases (A–I), the input concentration was 105 SIN/mL, and as the dilution factor was varied, the highest and lowest dilutions in the simulated ED plate were held fixed to and , respectively, by changing the total # of dilutions performed (simulated). Everything else is generated, computed, and represented visually as described in the caption of Fig 6.

