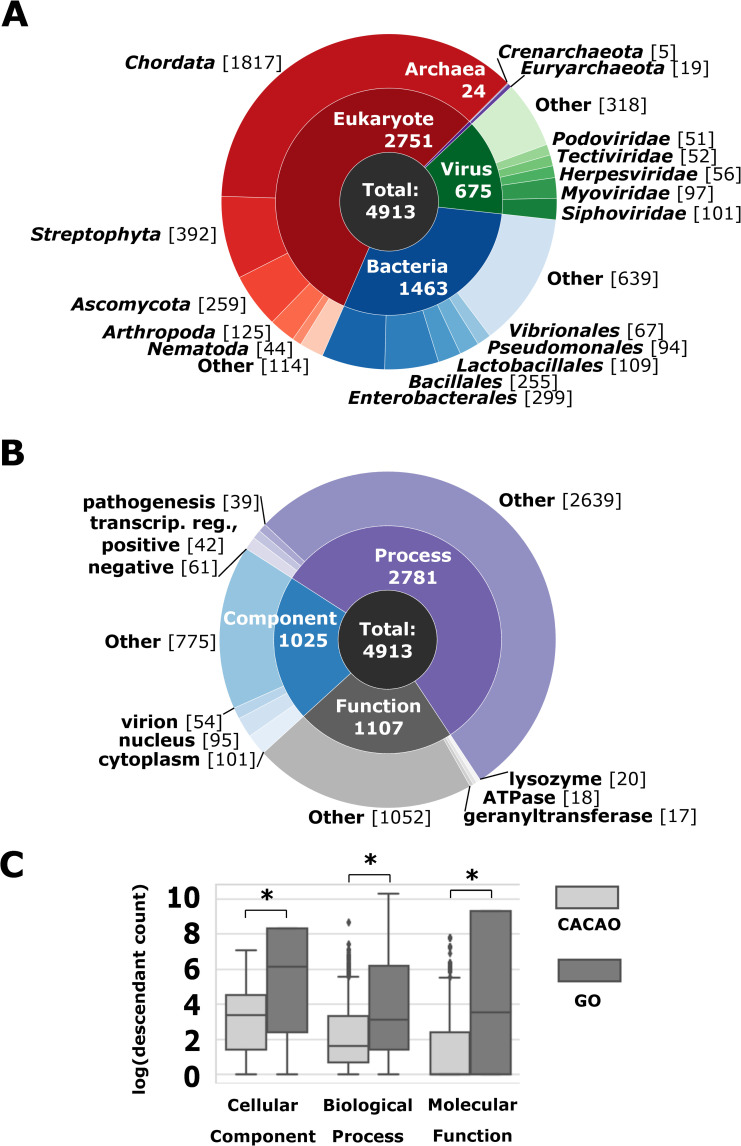
Fig 2. The GO annotations contributed by CACAO users are diverse and specific.
(A) Proteins annotated by CACAO users are depicted by species domain. The organisms most highly represented in each domain are displayed on the outer ring of the chart divided by the following rank: phylum for eukaryotes and archaea, order for bacteria, and family for viruses. The number of GO annotations in each category is indicated in brackets. (B) The distribution of GO terms used for CACAO annotations are graphed by aspect within the ontology. The top 3 terms within each aspect are labeled on the outer ring. For clarity, “activity” was dropped from each function term, and the process terms were abbreviated from “positive/negative regulation of transcription, DNA-templated” to “transcript. reg., positive or negative.” The number of GO annotations for each term is indicated in brackets. (C) The descendant counts, corresponding to depth within the ontology, for CACAO annotations (n = 4,913) and all other manual GO annotations in UniProt through 2019 (n = 255,958) are graphed. Significant differences measured by the Mann–Whitney test with p<0.001 are marked with an *. CACAO, Community Assessment of Community Annotation with Ontologies; GO, Gene Ontology.

