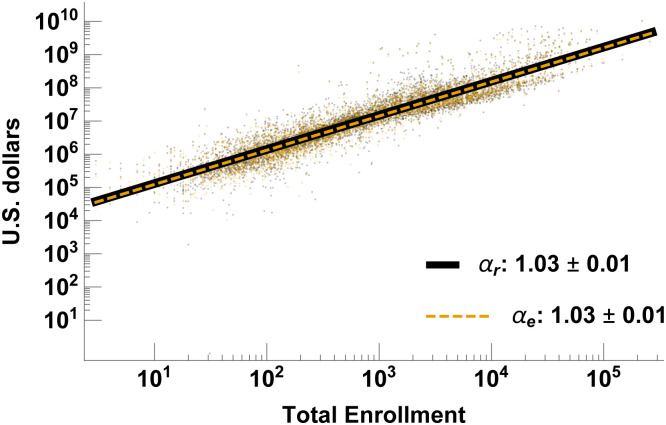
Fig 1. University scaling behavior.
The scaling relationships between total revenue (subscript “r”) and student enrollment, and total expenditure (subscript “e”) and student enrollment, combining all schools in the dataset. Note that revenue and expenditure are generally very well matched so both the data points and the regression lines overlap, which explains why much of the revenue data and the revenue regression line are hidden under the expenditure data and regression line.

