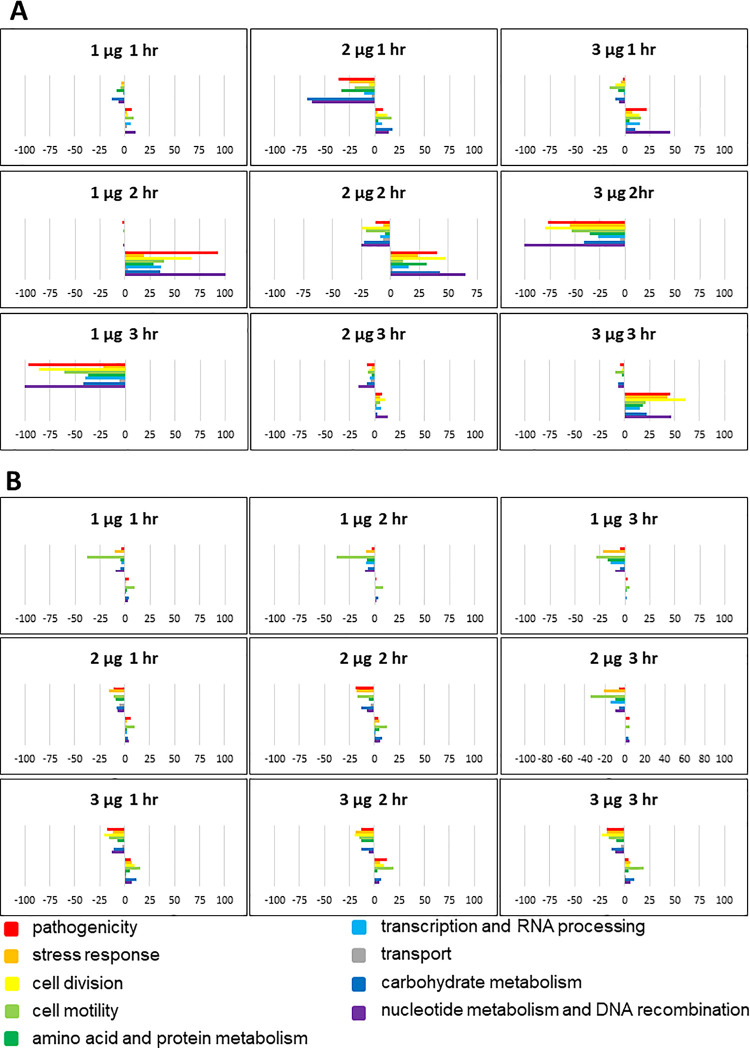
Fig 3.
Functional categories of genes in E. coli O157:H7 (A) and L. monocytogenes (B) that were differentially expressed at different durations of exposure (1 hr, 2 hr, 3 hr) to O3. Colored bars represent the numbers of differentially expressed genes assigned to each functional category. Positive bars denote the number of upregulated genes. Negative bars denote the number of downregulated genes. Genes assigned to ‘other category’ and ‘unknown’ are not included in this figure.

