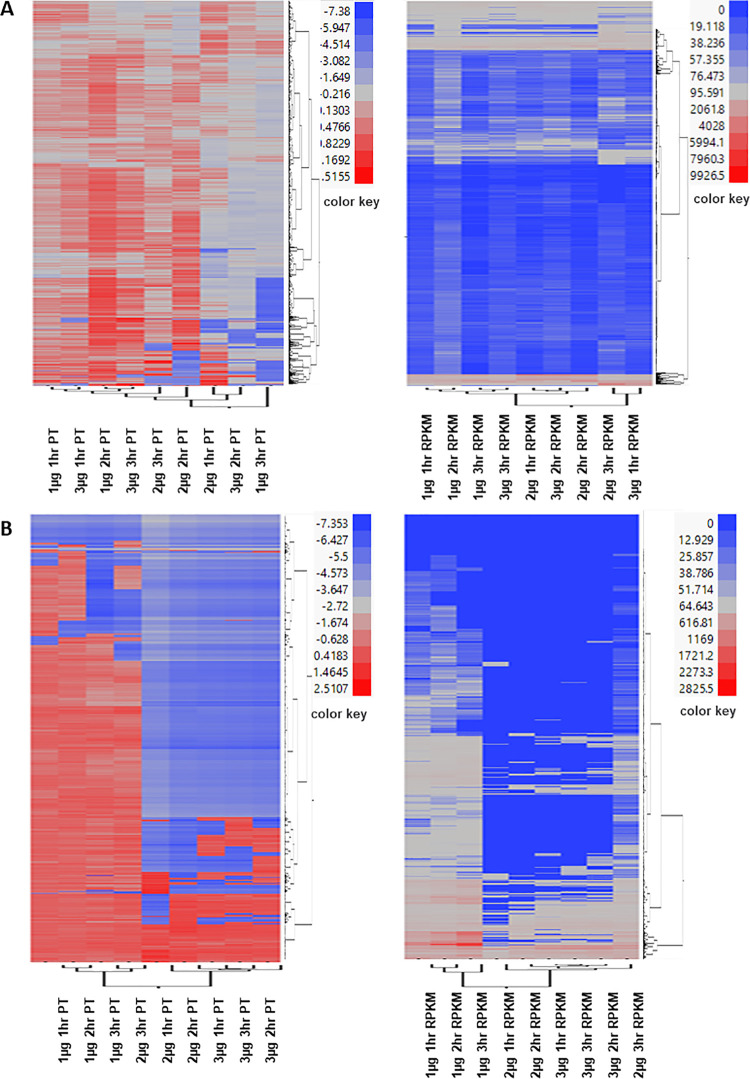
Fig 4.
Two-way hierarchical clustering of differentially expressed E. coli (A) and L. monocytogenes (B) genes. Ward’s Hierarchical Clustering was performed to uncover temporal profiles based on Propensity Scores (PS) (left) and RPKM values (right) across time-points. The number of clusters was set at 20 with color-coding, as shown in detail S1 Table. Red indicates high expression and green indicates low expression.

