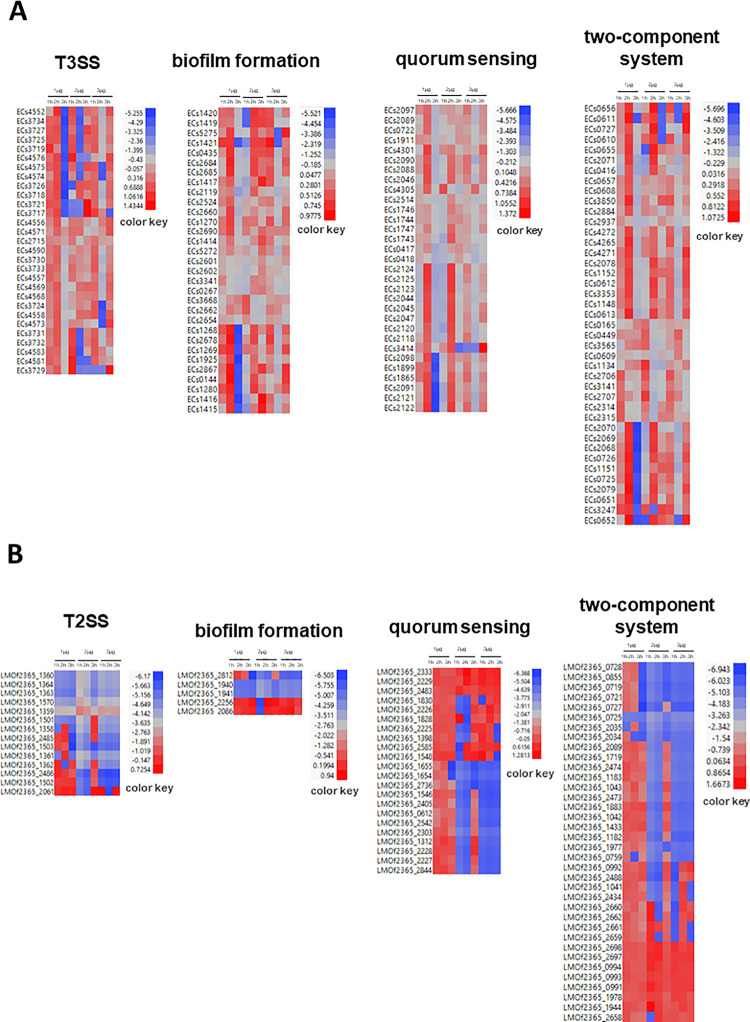
Fig 5.
Hierarchical clustering heat map of differentially expressed E. coli (A) and L. monocytogenes (B) genes associated with pathogenesis and stress response. PS of genes in response to O3 treatments after 1 hr, 2 hr and 3 hr were plotted. Red indicates high expression and green indicates low expression.

