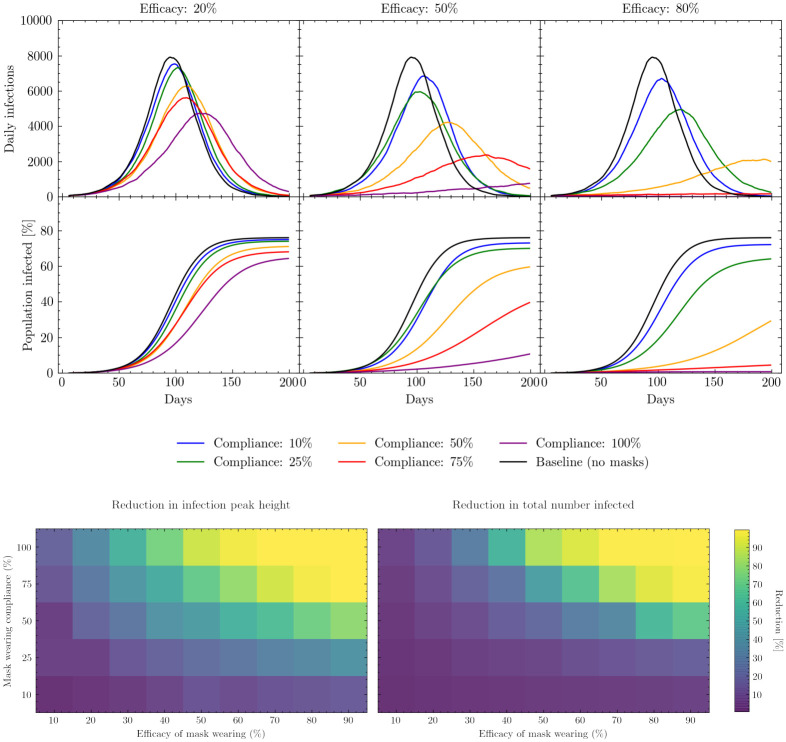
Fig 7. Mask wearing simulation results.
Upper: Simulated daily (7-day rolling average) and cumulative infections measured in days since the beginning of the simulation. Results show the effects of varying the compliance with mask wearing in different locations under different assumptions regarding mask efficacy. The baseline model is the scenario in which no masks are worn. See S1 Table for a presentation of the cumulative number of infections, peak intensity and peak timings for these scenarios. Lower left: percentage change in daily infection peak height as a function of mask wearing efficacy and compliance relative to the peak height of the baseline model. Lower right: percentage change in total number of infections up to a fixed point in simulated time as a function of mask wearing efficacy and compliance relative to the total number of infections simulated by the baseline model. The baseline model assumes no masks are worn.

