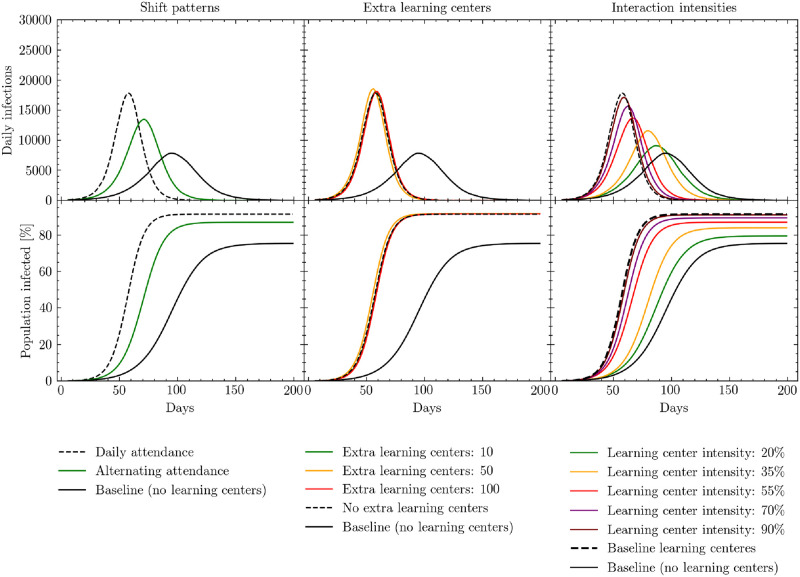
Fig 9. Simulated daily (7-day rolling average) and cumulative infections measured in days since the beginning of the simulation.
Black solid lines represent the baseline policy in which learning centers are closed. Black dashed lines represent the policy in which learning centers are open with no additional mitigation strategies. Results show the effects of opening learning centers under three conditions: adjusting the regularity with which children attend learning centers (left); opening additional learning centers (middle); reducing interaction intensities in the learning centers through strategies such as physical distancing, masks, and improved ventilation (right). Note that in the middle panel, the green line overlaps almost precisely with the baseline. See S1 Table for a presentation of the cumulative number of infections, peak intensity and peak timings for these scenarios.

