FIGURE 3.
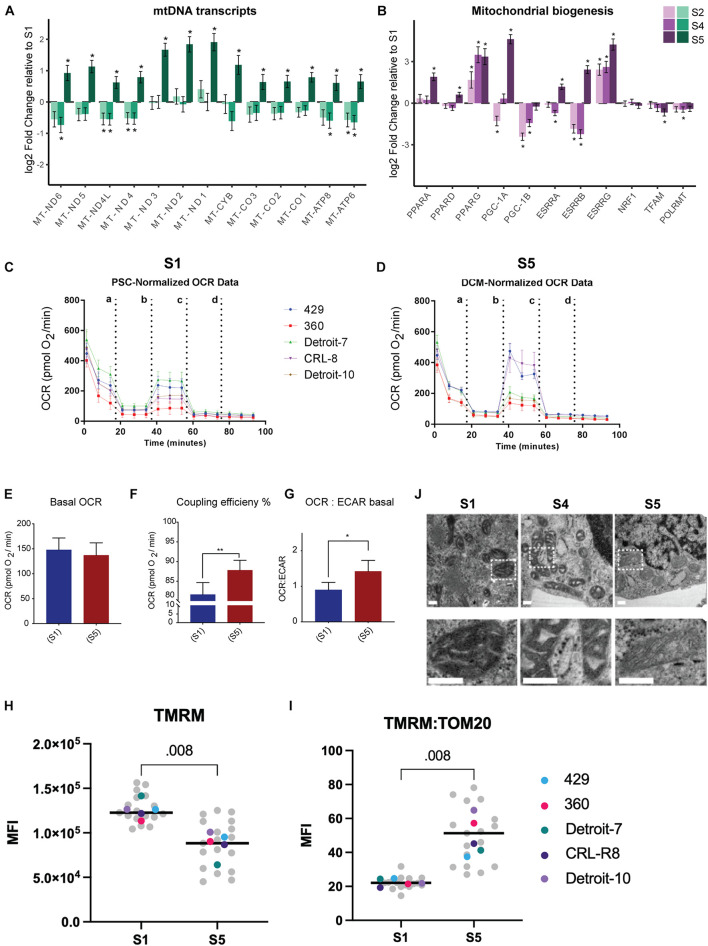
Higher mitochondrial respiration in differentiated mesodermal derivatives despite lower mitochondrial content. (A) The mtDNA transcripts collected via RNA-seq (Dataset B) at different stages of mesoderm differentiation suggest a significant increase in the number of mitochondrial transcripts in S5 relative to S1. (B) A panel of genes associated with metabolic remodeling was selected based on previous studies (Scarpulla et al., 2012; Zheng et al., 2016) to evaluate changes in gene expression at different stages of mesoderm differentiation relative to undifferentiated, stage S1 cells. Bar plots depict the estimated log twofold change ± s.e.m, n = 5. (C,D) Graphs present the result of OCR in hPSCs (C) and differentiated cells at S5 (D). Cells were exposed sequentially to oligomycin (a), CCCP (b), rotenone (c), and antimycin A (d). (E) To better visualize the result of Seahorse, we presented data as bar charts. Basal OCR level did not change in differentiated cells relative to undifferentiated hPSCs, which suggests higher rates of oxygen consumption by differentiated cells since we have shown that these cells have almost 50% less mitochondria compared with hPSCs. (F) Coupling efficiency increased significantly in differentiated cells, which showed a higher potential for ATP generation relative to undifferentiated hPSCs. (G) The basal OCR:ECAR ratio showed an increase in differentiated cells, confirming that these cells are more reliant on OXPHOS compared with undifferentiated hPSCs. Each bar in (E–G) shows mean ± SD, n = 5; and two-tailed unpaired t-tests with Welch’s correction were chosen to assess the statistical significance of the difference between undifferentiated hPSCs and S5. In all bar charts, * p < 0.05 and ** p < 0.01. (H) We assessed mitochondrial membrane potential by treating live cells with TMRM and subsequently with FCCP and plotting the difference in delta MFI (TMRM-MFI - FCCP-MFI) for each stage. We found an apparent higher TMRM concentration in hPSCs relative to S5 cells. (I) Next, we used the TOM20-MFI collected from a previous step (Figure 2E) and computed TOM20-MFI for all live cells in S1 and S5 (both TNNT2+ and TNNT2– included) as an indicator of mitochondrial mass. We then adjusted the TMRM level to the mitochondrial content of cells in each stage (TMRM-MFI:TOM20-MFI). The ratio of TMRM and TOM20 suggested a higher level of mitochondrial membrane potential per unit of mitochondrial mass for differentiated cells compared with undifferentiated hPSCs. In H and I plots, each data point in gray reflects a single experiment (MFI level of a single line from one run of differentiation at specific stage), and each colored dot represents the median MFI level of each line for each stage. The black line is the median of total measurements for each specific stage. Statistical significance was assessed using a two-tailed unpaired nonparametric t-test (Mann–Whitney test), n = 5. (J) Representative TEM pictures of mitochondria during cardiomyocyte differentiation of an hiPSC line (Detroit-7) at S1, S4, and S5. Mitochondria appear smaller with wider, more immature cristae at stages S1 and S4; while at S5, more mitochondria show an expanded matrix with typical narrow, mature cristae. The bottom panel is the magnification of the indicated areas in the top panel. Scale bar: 200 nm. MtDNA, mitochondrial DNA; OCR, oxygen consumption rate; hPSC, human pluripotent stem cell; OXPHOS, oxidative phosphorylation; MFI, median fluorescence intensity; TEM, transmission electron microscope; hiPSC, human induced pluripotent stem cell.

