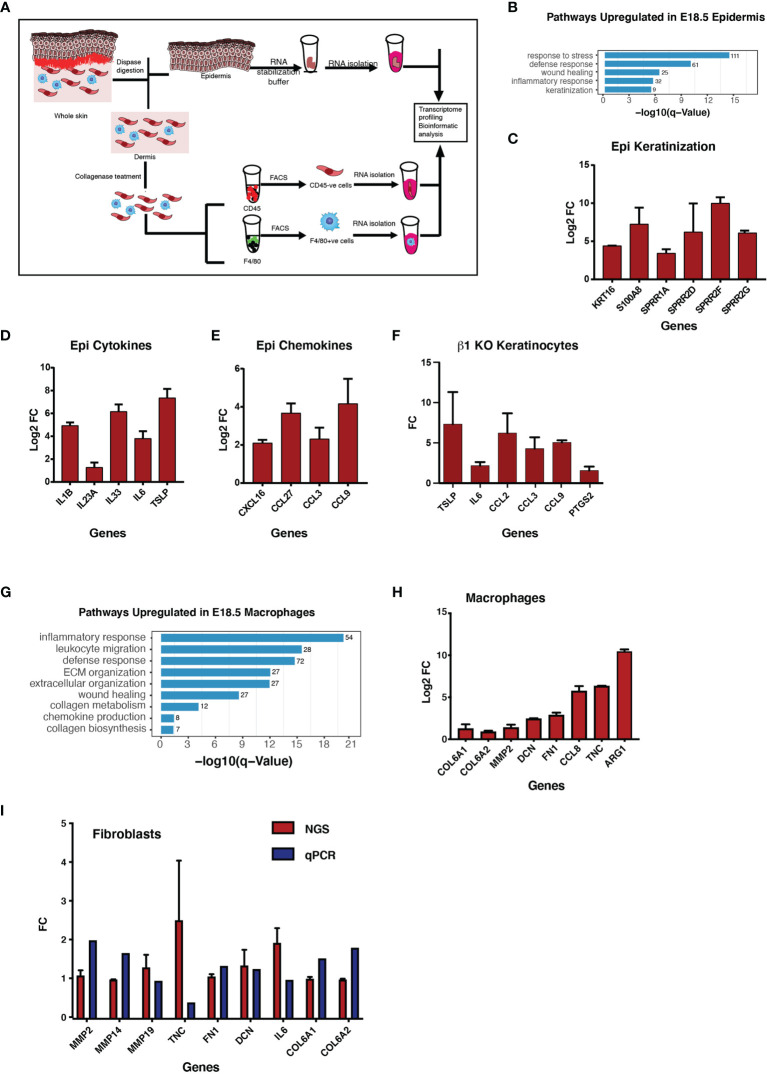
Figure 2.
Increased expression of the proinflammatory cytokines in the epidermis and increased expression of ECM transcripts in macrophages in the KO skin. Graphical illustration of the steps involved in the isolation of epidermis, fibroblasts and macrophages to perform RNA sequencing analysis at E18.5 (A). Gene Ontology analyses of pathways upregulated in the epidermis E18.5 tgβ1 epidermal KO skin (B) (N=2). Real-time qPCR for the cytokines, chemokines and the keratinization genes expressed in the KO epidermis at E18.5 compared to the control (C–E) (N=2). Fold changes in the control are normalized to 1. Real-time qPCR for the cytokines and chemokines upregulated in the β1 KO keratinocytes (F) (N=2). Gene Ontology analyses of pathways upregulated in the macrophages in the E18.5 KO skin (G). Real-time qPCR for the ECM transcripts expressed in the macrophages in the tgβ1 epidermal KO skin compared to the control (H) (N=2). Fold changes in the control are normalized to 1. Bar graphs representing ECM transcripts expressed in the fibroblasts in the E18.5 KO skin (I) (N=2).

