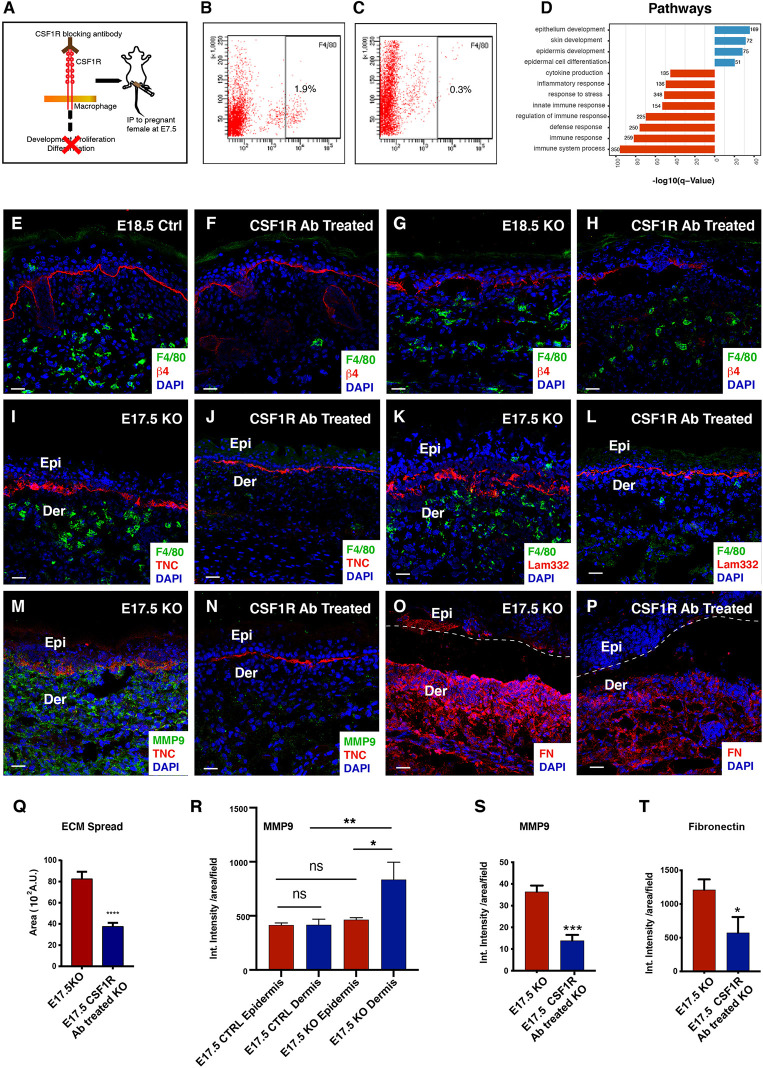
Figure 4.
Reduced BM disruption and ECM abundance in the macrophage depleted CSF1R blocked skin. Graphical illustration of the dosing strategy of CSF1R blocking antibodies to pregnant dams (A). Flow cytometry analysis for F4/80 expression in the E17.5 Epidermal Itgβ1 KO PBS and CSF1R blocked skin, respectively (B, C). Gene Ontology pathway analysis for the upregulated (blue) and downregulated (red) genes in the epidermis of the CSF1R blocked KO skin (D). Immunostaining for F4/80 and Itgβ4 in the control, CSF1R antibody treated, untreated Itgβ1 KO, and CSF1R antibody treated epidermis Itgβ1 KO skin at E18.5 (E–H). Immunostaining in the E17.5 PBS treated and CSF1R antibody treated KO skin for F4/80 and TNC (I, J); F4/80 and LAM332 (K, L); MMP 9 and TNC (M, N) and Fibronectin (O, P) (N=2). The white dashed line separates the epidermis (Epi) and dermis (Der). Scale bars: 20 µm. Quantification of the area of spread of the Lam332 staining in the E17.5 epidermal Itgβ1 KO PBS and CSF1R blocked skin (Q) (Control N=3, CSF1R blocked N=4; ****p ≤ 0.0001). Quantification of the staining intensity of MMP9 expression in the epidermis and the dermis of the PBS and the CSF1R antibody treated KO samples (R) (N=2; *p ≤ 0.05, **p ≤ 0.01, ns=not significant. Quantification of the staining intensity for MMP9 and fibronectin (FN1) in the E17.5 epidermal Itgβ1 KO PBS and CSF1R blocked skin (S, T) (N=2; *p ≤ 0.05).

