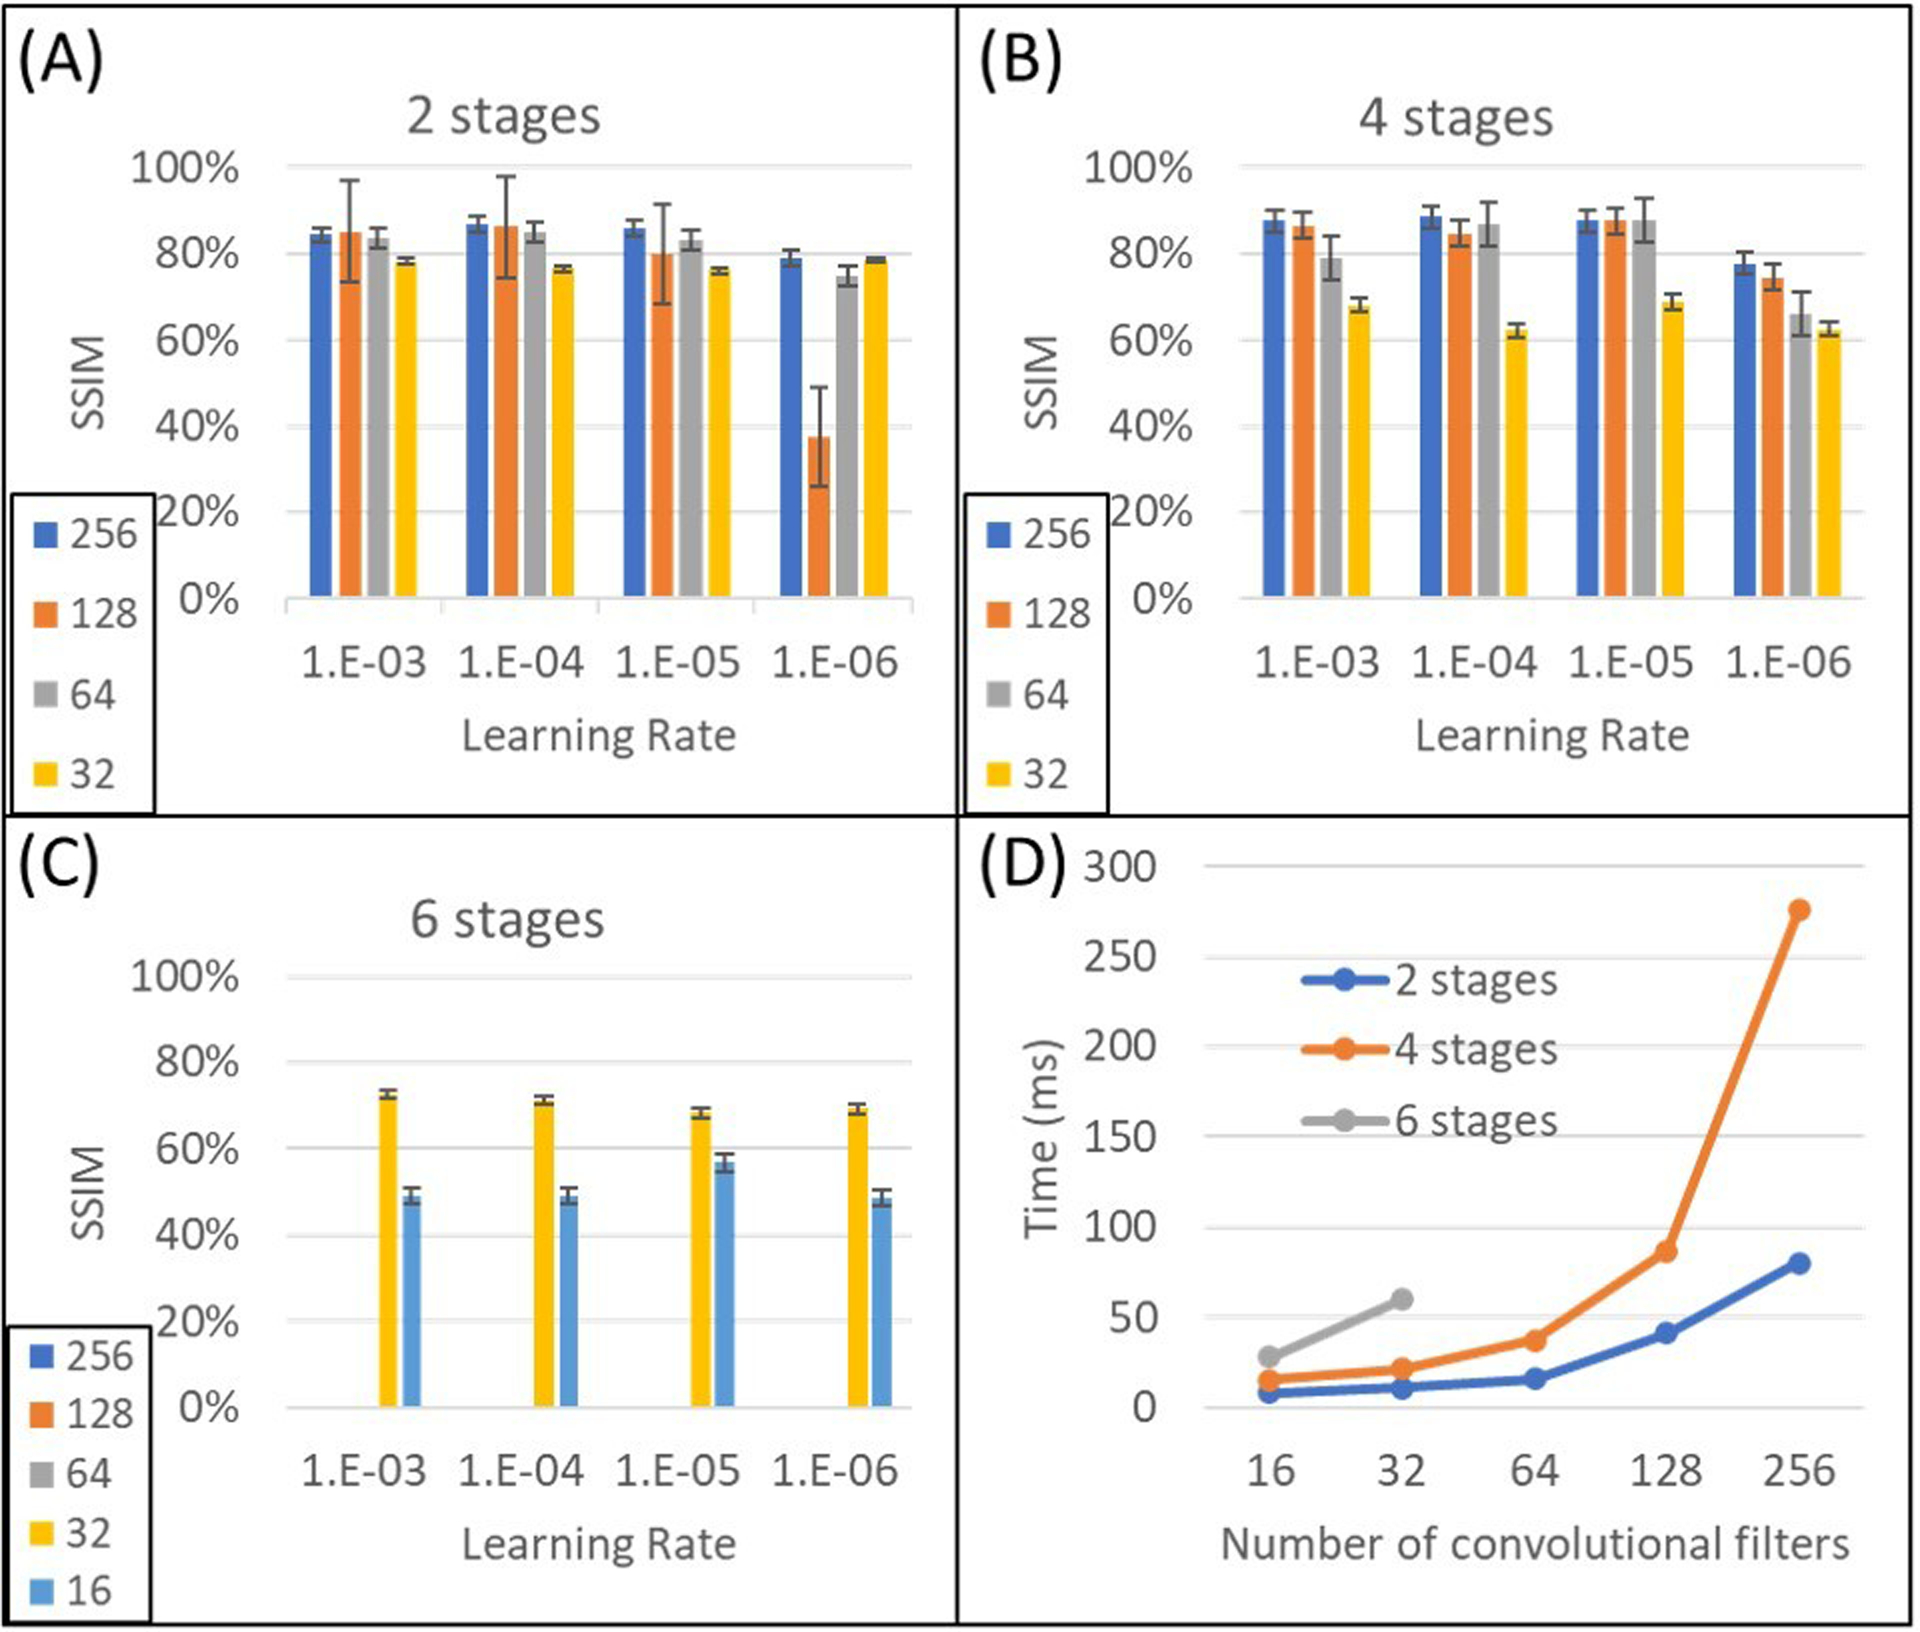
FIGURE 3.

Performance comparison of three U-Nets due to different hyperparameters and time budget. All structures were trained and tested on the same realistic body model (Ella) for 3T body imaging. SSIM of (A) 2-stage, (B) 4-stage, and (C) 6-stage U-Nets are depicted. (D) Time to train each image showed exponential increase among different U-Nets. Increasing the length of feature maps (n) showed linear increase on training time for the same network up to n=128.
