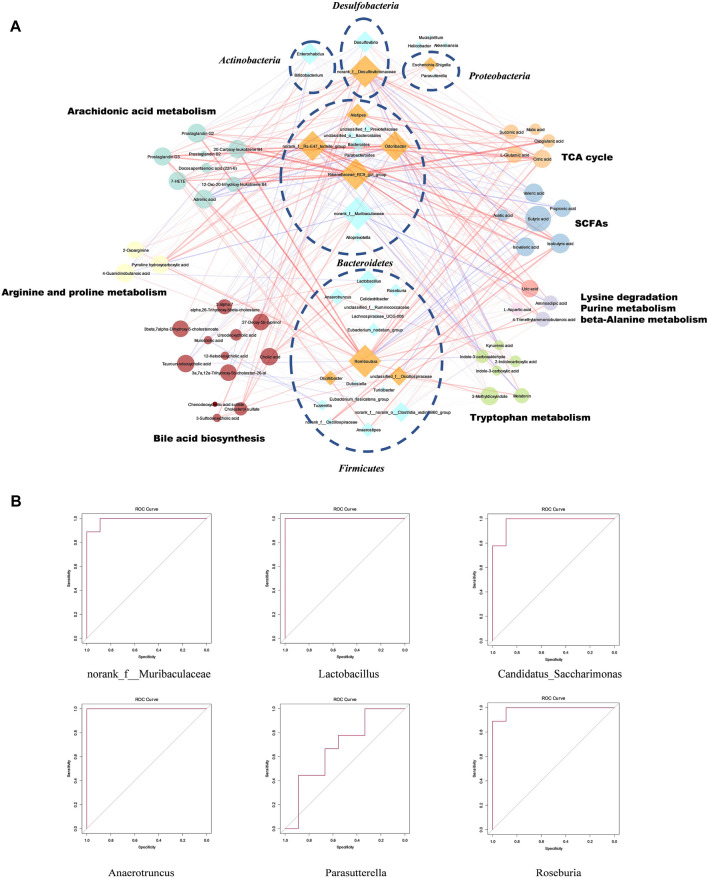
FIGURE 5.
The relationship between bacteria and metabolic pathways, and functional specific bacteria in SFE treatment. (A) Co-expression network of specific bacteria and differential metabolites (the strength of the interaction is represented by the thickness and depth of the lines. The stronger the interaction, the thicker and darker a line is. The red line represents the positive relationship, and the blue line represents the negative relationship, the main pathogenic bacteria of UC are shown as orange). (B) The ROC curve constructed based on six functional specific bacteria.

