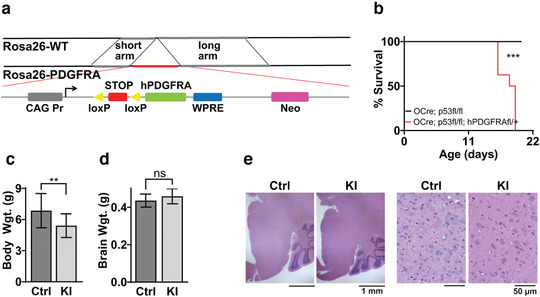
FIGURE 1.

Generation and phenotype of hPDGFRA KI mice. (a) Schematic of the Rosa26 locus in control and hPDGFRA KI mice. hPDGFRA is downstream of the CAG promoter and a STOP codon flanked by loxP sites. (b) Kaplan–Meier survival curves of Olig2‐Cre; p53fl/fl (Ctrl, black, median survival undefined, n = 11) and Olig2‐Cre; p53fl/fl; hPDGFRAfl/+ (KI, red, 18 ± 0.3651 days, n = 10) mice. p = .0001, log‐rank (Mantel–Cox) test. (c) Body weights of P18 and P19 Olig2‐Cre; p53fl/fl; hPDGFRA+/+ (Ctrl, 6.8523 ± 0.4576 g, n = 13) and Olig2‐Cre; p53fl/fl; hPDGFRAfl/+ (KI, 5.4088 ± 0.4024 g, n = 8) mice. p = .0431, two‐tailed unpaired Student t‐test. (d) Brain weights of P18 and P19 Ctrl (0.4361 ± 0.0096 g, n = 13) and KI (0.4591 ± 0.0143 g, n = 8) mice. p = .1811, two‐tailed unpaired Student t‐test. Error bars represent standard error. (e) H&E images of the brainstem (BS) of P20 Ctrl and P19 KI mice. Images representative of n = 4 each for Ctrl and KI
