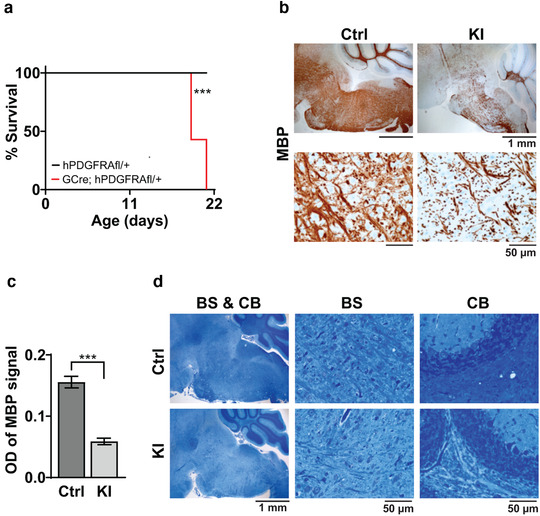
FIGURE 8.

Prenatal overexpression of hPDGFRA in GFAP‐progenitors leads to hypomyelination. (a) Kaplan–Meier survival curves of hPDGFRAfl/+ (Ctrl, black, median survival undefined, n = 13), and GFAP‐Cre; hPDGFRAfl/+ (KI, red, 19 ± 0.2745 days, n = 13) mice. p = .0001, long‐rank (Mantel–Cox) test. (b,c) IHC images (b) and quantitation (c) of MBP OD in the BS of P19 Ctrl and P20 KI mice. Error bars represent standard errors. (d) LFB stained images of P19 Ctrl and P20 KI mouse BS and CB. Images representative of n = 7 each for Ctrl and KI
