. 2021 Oct 28;10:e67476. doi: 10.7554/eLife.67476

Figure 4. Blocking 6-phosphogluconate dehydrogenase (6PGD) in regulatory T cells (Tregs) induces reprogramming of glycolysis, mitochondrial respiration, and non-oxidative pentose phosphate pathway (PPP).

(A–B) Extracellular acidification and oxygen consumption analysis on YFP+ sorted cells from Pgdfl/fl Foxp3Cre and wild-type (WT) mice was performed using Seahorse XF24 metabolic analyzer as described in supplemental information. The extracellular acidification rate (ECAR) (A) and oxygen consumption rate (OCR) (B) are shown (N = 4). (C) YFP+ cells glucose (Glc) uptake capacity was determined by 2-NBDG uptake, mitochondrial potential (ΔΨm) by TMRE, mitochondrial mass by MitoTracker Deep Red FM and mitochondrial ROS by MitoSox Red. Results are representative of three independent experiments with N = 4 per group. (D) YFP+ cells were sorted from WT and Pgdfl/flFoxp3Cre mice and cultured in the presence of IL-2 (700 IU/ml) and anti-CD3/anti-CD28 coated beads (Treg:beads ratio 1:3) plus D7-Glc and 13C5,15N2-glutamine (Gln) for 48 hr. Isotope labeling patterns of metabolites of cell extracts were analyzed by IC-UHRMS. Data shown demonstrates D7-Glc and 13C5,15N2-Gln incorporation into the PPP metabolites via non-oxidative PPP and gluconeogenesis. Results were generated with N = 2. Legend in X-axis D* = sum of D1 to Dx or Glc-derived species; C* = sum of 13C1 to 13Cx or Gln-derived species; C*D* = sum of dual 13C1 to 13Cx and D1 to Dx or Glc and Gln-derived species; G6P, glucose-6-phosphate; 6PG, 6-phosphogluconate; R5P, ribose-5-phosphate; S7P, sedoheptulose-7-phosphate; Gly3P, glyceraldehyde-3-phosphate; X5P, xylulose-5-phosphate; E4P, erythrose-4-phosphate; F6P, fructose-6-phosphate; OAA, oxaloacetate; PEP, phosphoenolpyruvate.

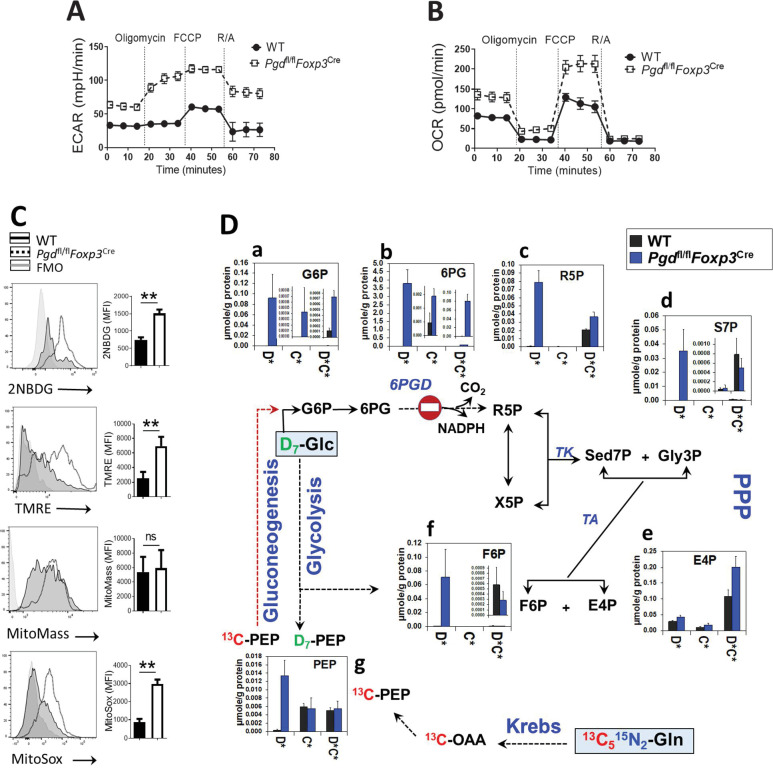
Figure 4.

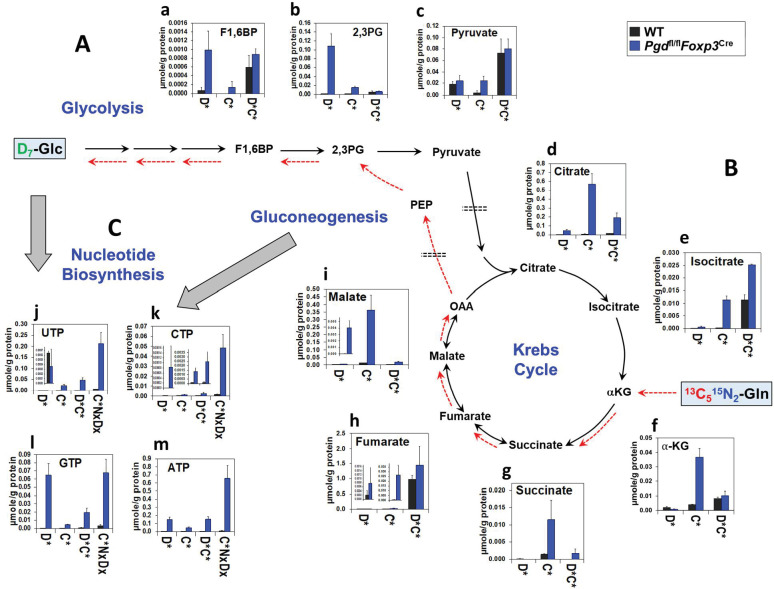
Figure 4—figure supplement 1. Glycolysis, Krebs cycle, and nucleotide biosynthesis are enhanced in 6-phosphogluconate dehydrogenase (6PGD)-deficient Tregs.

Figure 4—figure supplement 1.

(A–C) The same cell extracts as in Figure 4 were analyzed for metabolites of glycolysis (A), the Krebs cycle (B), and nucleotide biosynthesis (C) by IC-UHRFTMS. Legend in X-axis: D* = sum of D1 to Dx or Glc-derived species; C* = sum of 13C1 to 13Cx or Gln-derived species; C*D* = sum of dual 13C1 to 13Cx and D1 to Dx or Glc and Gln-derived species; C*NxDx = sum of triply labeled (13C1 to 13Cx, D1 to Dx, and 15N1 to 15Nx) species. X is ≥1 for each metabolite isotopologue. Abbreviations used are: F1,6BP: fructose-1,6-bisphosphate; 2,3PG: 2,3-diphosphoglycerate; αKG: α-ketoglutarate; OAA: oxaloacetate; UTP: uridine triphosphate; CTP: cytidine triphosphate; GTP: guanosine triphosphate; ATP: adenosine triphosphate.
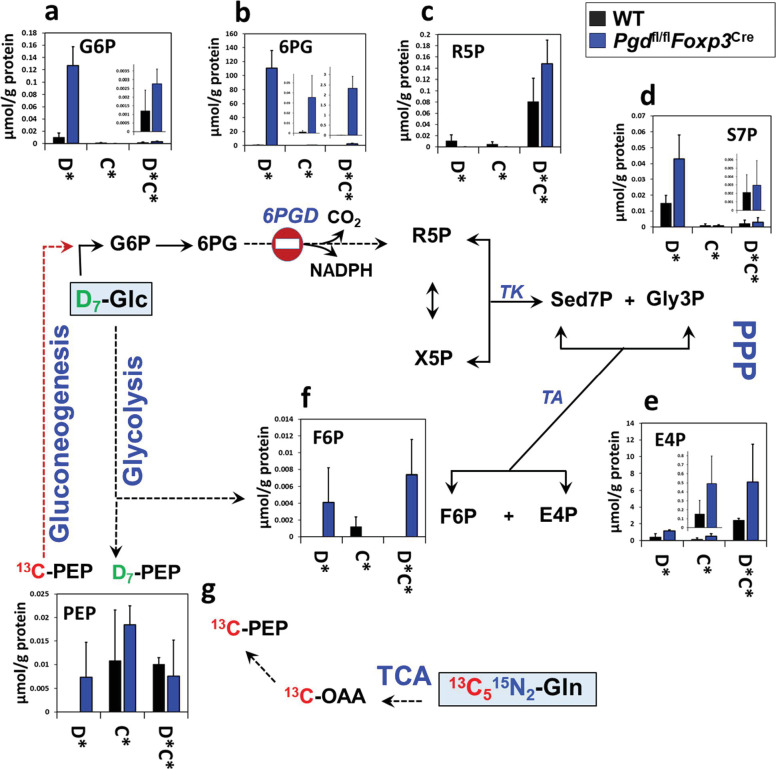
Figure 4—figure supplement 2. Pentose phosphate pathway (PPP) pathway reprogramming in 6-phosphogluconate dehydrogenase (6PGD)-deficient regulatory T cells (Tregs) generated in vitro.

Figure 4—figure supplement 2.

Wild-type (WT) and Pgdfl/flFoxp3Cre naïve CD4+ T cells were differentiated into Tregs (as inducible Tregs [iTreg]) in the presence of IL-2+ TGF-β for 4 days, in vitro. In last 48 hr of polarization D7-glucose (Glc) and 13C5,15N2-glutamine (Gln) were replaced in the media. Isotope labeling patterns of metabolites of cell extracts were analyzed by IC-UHRMS. Data shown demonstrates D7-Glc and 13C5,15N2-Gln incorporation into the PPP metabolites via non-oxidative PPP and gluconeogenesis. Results were generated with N = 2. Abbreviations are the same as Figure 4.
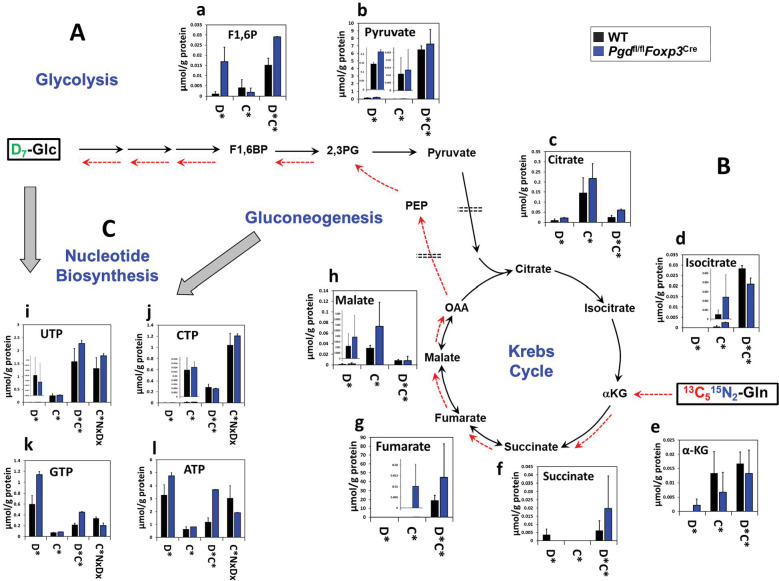
Figure 4—figure supplement 3. Glycolysis, Krebs cycle, and nucleotide biosynthesis reprogramming in 6-phosphogluconate dehydrogenase (6PGD)-deficient Tregs generated in vitro.

Figure 4—figure supplement 3.

(A–C) The same cell extracts as in Figure 4—figure supplement 2 were analyzed for metabolites of glycolysis (A), the Krebs cycle (B), and nucleotide biosynthesis (C) by IC-UHRFTMS. These results were from in vitro generated Tregs as inducible Tregs (iTreg). Legend and abbreviations are the same as Figure 4—figure supplement 1.