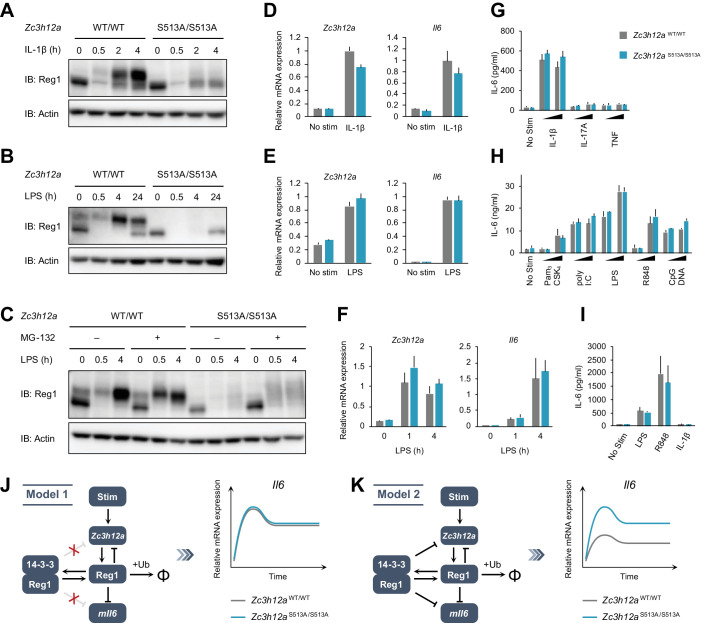
Figure 4. The S513A mutation destabilizes Regnase-1 protein but does not affect target mRNA abundance.
(A–C) Immunoblot analysis of Zc3h12aWT/WT and Zc3h12aS513A/S513A MEFs stimulated with IL-1β (10 ng/ml) (A), BMDMs stimulated with LPS (100 ng/ml) (B), and thioglycollate-elicited PECs stimulated with LPS (100 ng/ml) (C) for indicated time. PECs were pretreated with MG-132 (5 μM) 2 hr before the stimulation. (D)-(F) mRNA expression of Zc3h12a and Il6 in Zc3h12aWT/WT and Zc3h12aS513A/S513A MEFs stimulated with IL-1β (10 ng/ml) for 4 hr (D), BMDMs stimulated with LPS (100 ng/ml) for 4 hr (E), and thioglycollate-elicited PECs stimulated with LPS (100 ng/ml) for indicated time (F). (G)-(I) IL-6 secretion in Zc3h12aWT/WT and Zc3h12aS513A/S513A MEFs stimulated with IL-1β (10 ng/ml), IL-17A (50 ng/ml), or TNF (10 ng/ml) for 24 hr (G), BMDMs stimulated with Pam3CSK4 (1 or 10 ng/ml), poly I:C (10 or 100 μg/ml), LPS (10 or 100 ng/ml), R848 (10 or 100 nM), or CpG DNA (0.1 or 1 μM) for 24 hr (H), and thioglycollate-elicited PECs stimulated with LPS (100 ng/ml), R848 (100 nM), or IL-1β (10 ng/ml) for 24 hr (I). (J) Schematic representation of Model 1 in which 14-3-3-bound Regnase-1 does not have the function of degrading its target mRNAs. This model could explain the experimental observations. (K) Schematic representation of Model 2 in which 14-3-3-bound Regnase-1 maintains some ability to degrade its target mRNAs. This model is not consistent with the experimental observations. In (D)-(I), bars represent mean values of biological replicates (n = 3), and error bars represent standard deviation. Data is representative of two independent experiments, each with three biological replicates.
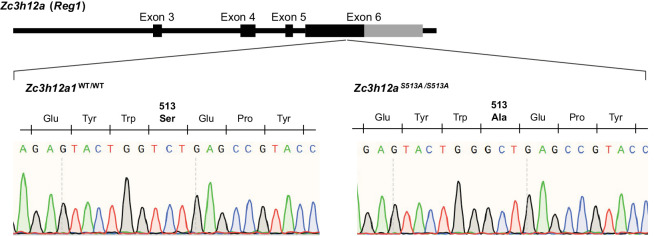
Figure 4—figure supplement 1. Schematic illustration of Zc3h12a gene in mice.
Figure 4—figure supplement 2. The protein stability of Regnase-1-WT and S513A.
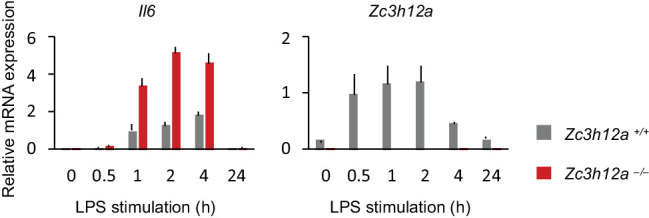
Figure 4—figure supplement 3. Il6 expression in Zc3h12a–/– PECs mRNA expression of Il6 and Zc3h12a in Zc3h12aWT/WT and Zc3h12a–/– thioglycollate-elicited PECs stimulated with LPS (100 ng/ml) for indicated time.


