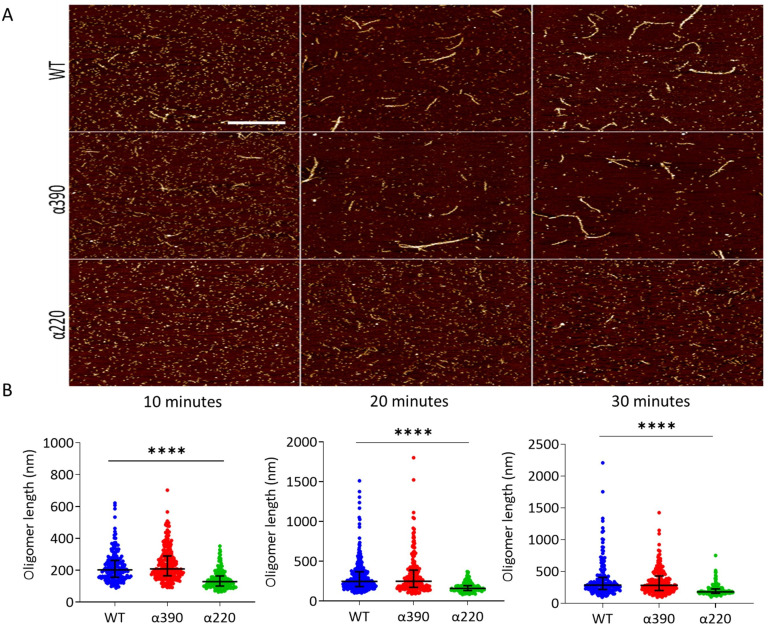
Figure 3. Early fibrin polymers length comparison.
(A) Representative images of fibrin polymers lengths for truncated and WT fibrinogens at 10, 20, and 30 min, scale bar is 1 µm. (B) Average polymer length was significantly decreased for α220, but not α390, at all time points compared to WT. Each point in (B) represents a single measured polymer; at least 165 polymers were measured for each time point/fibrinogen variant, and at least three replicates were made of each sample. Results shown as median ± IQR, ****p<0.0001 by Kruskal–Wallis test with Dunn’s multiple comparison test relative to WT.

