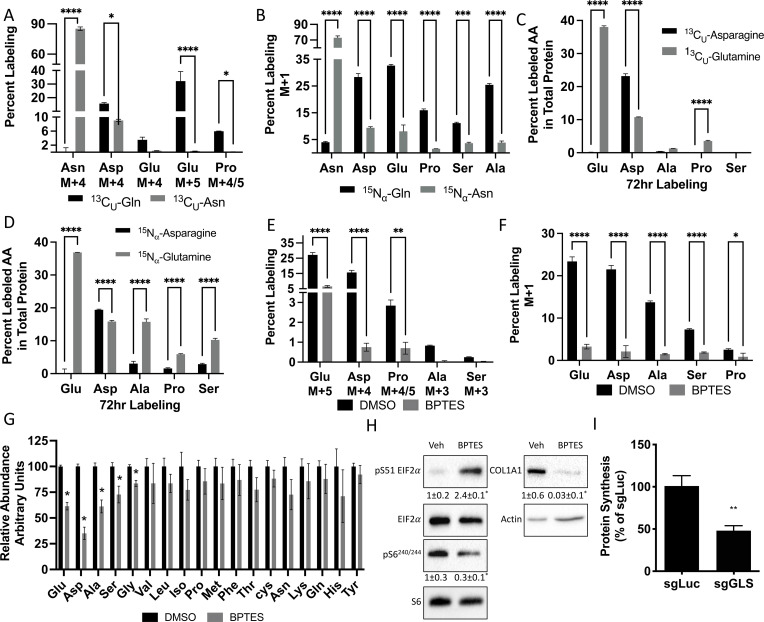
Figure 6. Glutamine and asparagine are utilized for de novo amino acid biosynthesis.
(A–B) Fractional contribution of [U-13C]glutamine or [U-13C]asparagine (A) or [α−15N]glutamine or [α–15N]asparagine (B) to asparagine, aspartate, glutamate, proline, serine, and alanine. (C–D) Fractional contribution of [U-13C]glutamine or [U-13C]asparagine (C) or [α–15N]glutamine or [α–15N]asparagine (D) to asparagine, aspartate, glutamate, proline, serine, and alanine in total protein. (E–F) Effect of BPTES treatment on the fractional contribution of [U-13C]glutamine (E) or [α–15N]glutamine (F) to amino acids. * p ≤ 0.05, ** p ≤ 0.005, *** p ≤ 0.0005, **** p ≤ 0.00005 by ordinary one-way ANOVA with Tukey’s multiple comparisons. (G) Effect of GLS inhibition on intracellular amino acid concentration measured by mass spectrometry. * p ≤ 0.05, multiple unpaired t-tests. Error bars depict SD.(H) Western blot analyses of the effects of BPTES treatment on mTORC1 signaling, Eif2a phosphorylation and COL1A1 expression. Phospho-proteins normalized to respective total protein. COL1A1 normalized to beta-actin. Fold change± SD for three independent experiments. * p ≤ 0.05 by an unpaired two-tailed Student’s t-test. (I) Effect of GLS inhibition on protein synthesis as determined by the rate of 3H Proline incorporation into total protein. * p ≤ 0.05 by an unpaired two-tailed Student’s t-test. Error bars depict SD.


