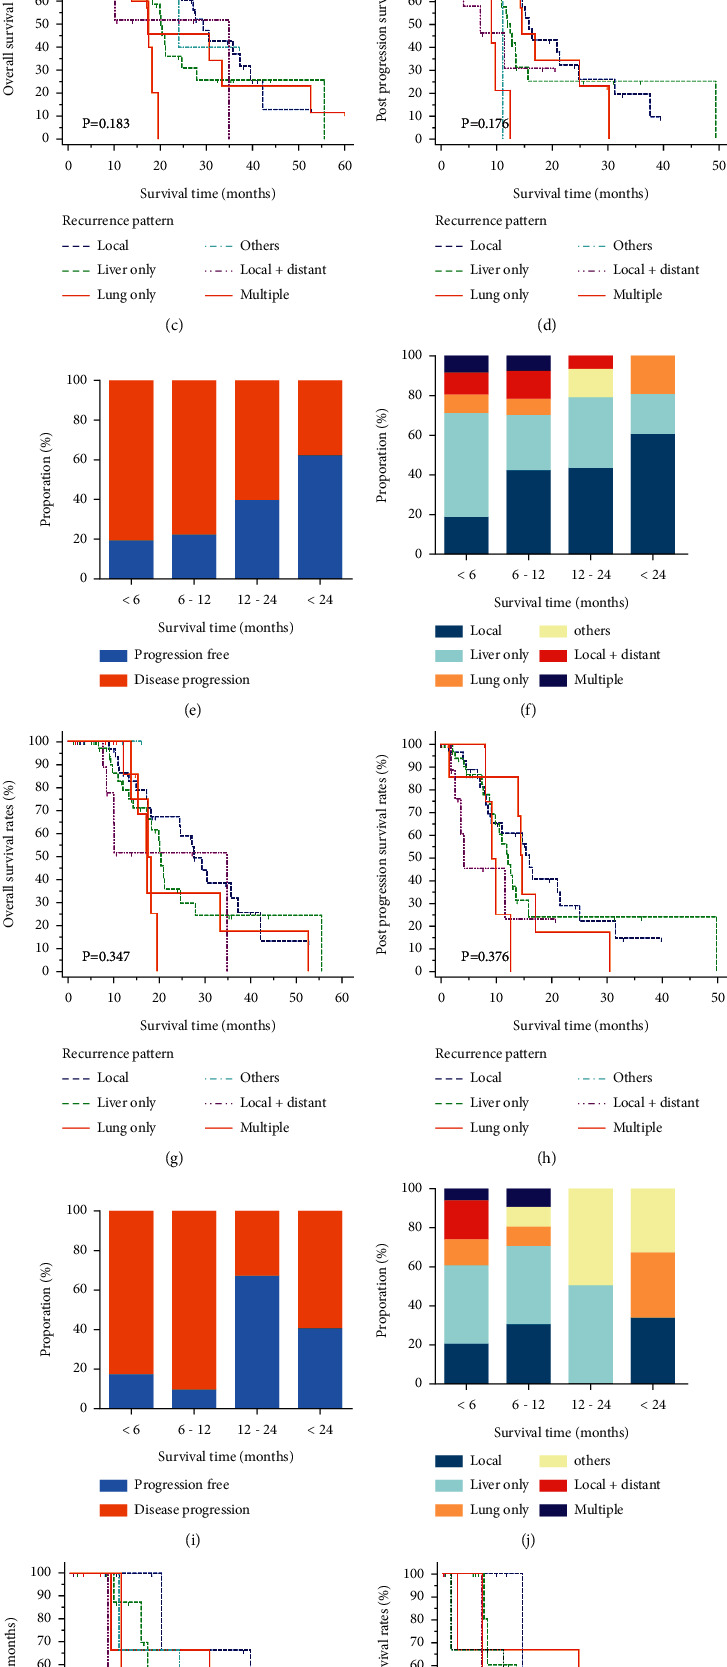
Figure 2.

Distribution of tumor progression patterns at different time points and their survival analyses. The proportions of tumor progression patterns (a, b). The OS (c) and PPS (d) stratified by tumor progression patterns in all PDAC patients. The proportions of tumor progression patterns (e, f). The OS (g) and PPS (h) stratified by tumor progression patterns in PDAC patients of the head. The proportions of tumor progression patterns (i, j). The OS (k) and PPS (l) stratified by tumor progression patterns in PDAC patients of the body/tail.
