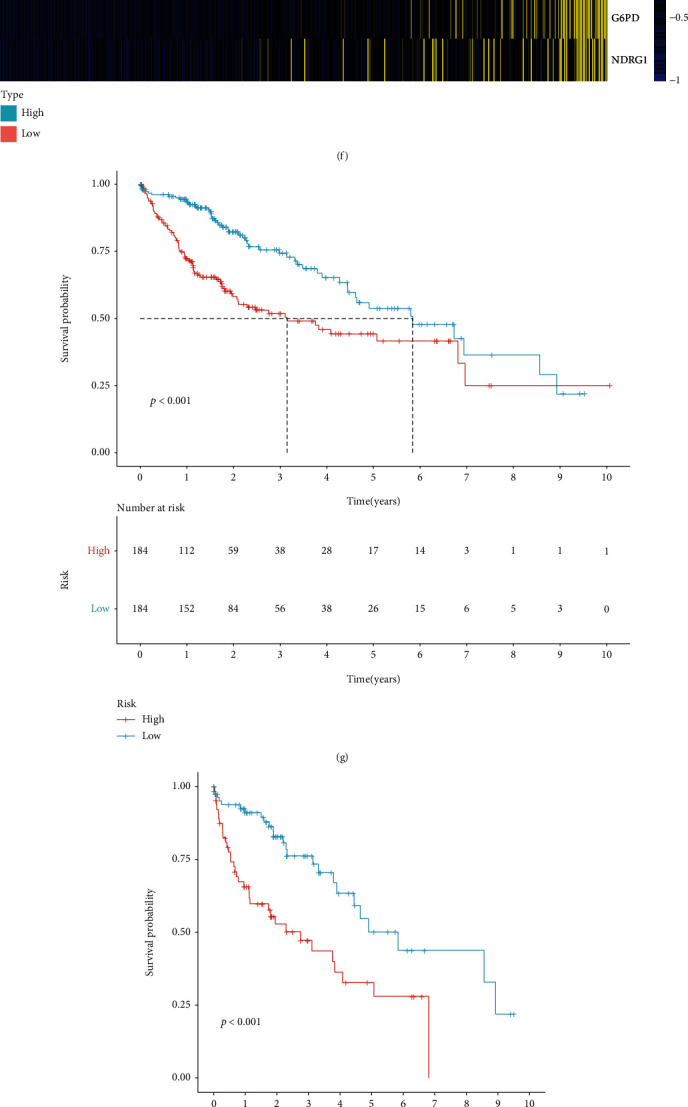
Figure 3.

Construction of a CCP-derived prognostic gene signature for HCC in TCGA-LIHC cohort. (a) The change in trajectory of candidate variables. The x-axis represented the log (lambda) of variables, and the y-axis represented the coefficient of variables. (b) Partial likelihood deviance corresponding to each lambda. (c) The interactions between six candidate genes in the LASSO model. (d) Distribution of CCP-derived RS in each HCC patient. The high- and low-risk groups were separated in line with the median of RS (dotted line). (e) Distribution of survival status in high- and low-risk groups. (f) Heat map visualizing the mRNA expression of six candidate variables in high- and low-risk groups. Yellow, upregulation and blue, downregulation. (g) Prognostic analyses of HCC patients with high and low RS in TCGA-LIHC cohort. (h–o) Comparison of survival outcomes of HCC patients with high and low RS in each subgroup of age ≥ 65 and age < 65, female and male, G1-2 and G3-4, and stages I-II and stages III-IV.
