Figure 5.

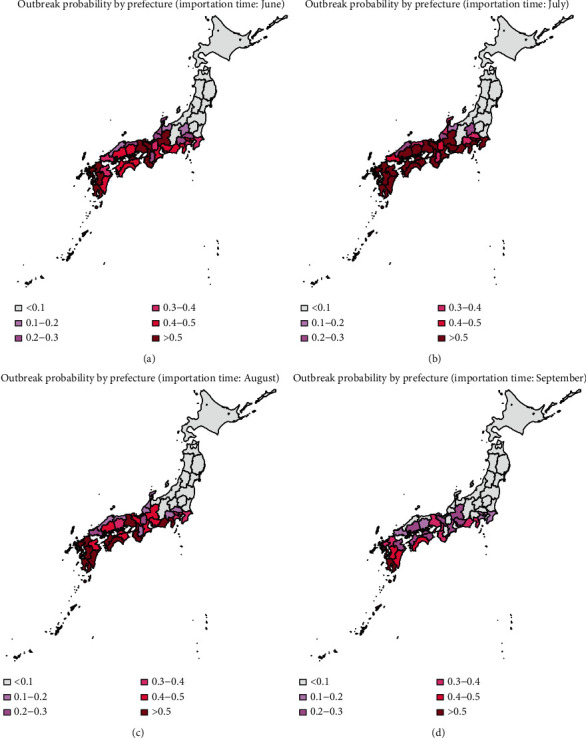
Heat map of the mean probability of outbreak in November (2013–2016), when the infectious individual is imported in June, July, August, and September; k=0.5.

Heat map of the mean probability of outbreak in November (2013–2016), when the infectious individual is imported in June, July, August, and September; k=0.5.