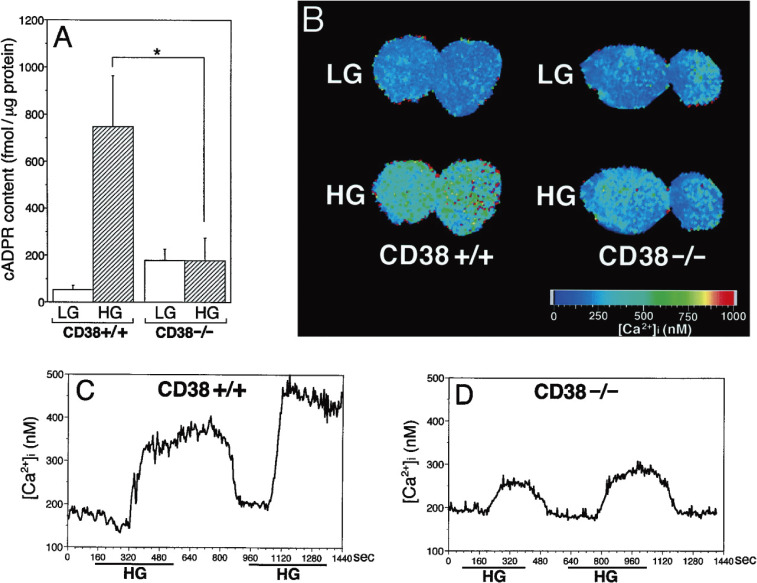
Figure 10.
Measurement of cADPR content and glucose-induced [Ca2+]i changes in CD38+/+ and CD38−/− islets (adapted from Ref. 91). A. cADPR content in isolated islets under 2.8 mM glucose (LG) or 20 mM glucose (HG) concentrations, expressed as fmol per µg of protein of islet homogenate. n = 3–4 for each point. *, P < 0.05. B. Digital imaging of [Ca2+]i in the islets. C. Changes in [Ca2+]i in the CD38+/+ islets. A representative record from four experiments. D. Changes in [Ca2+]i in the CD38−/− islets. A representative record from seven experiments.

