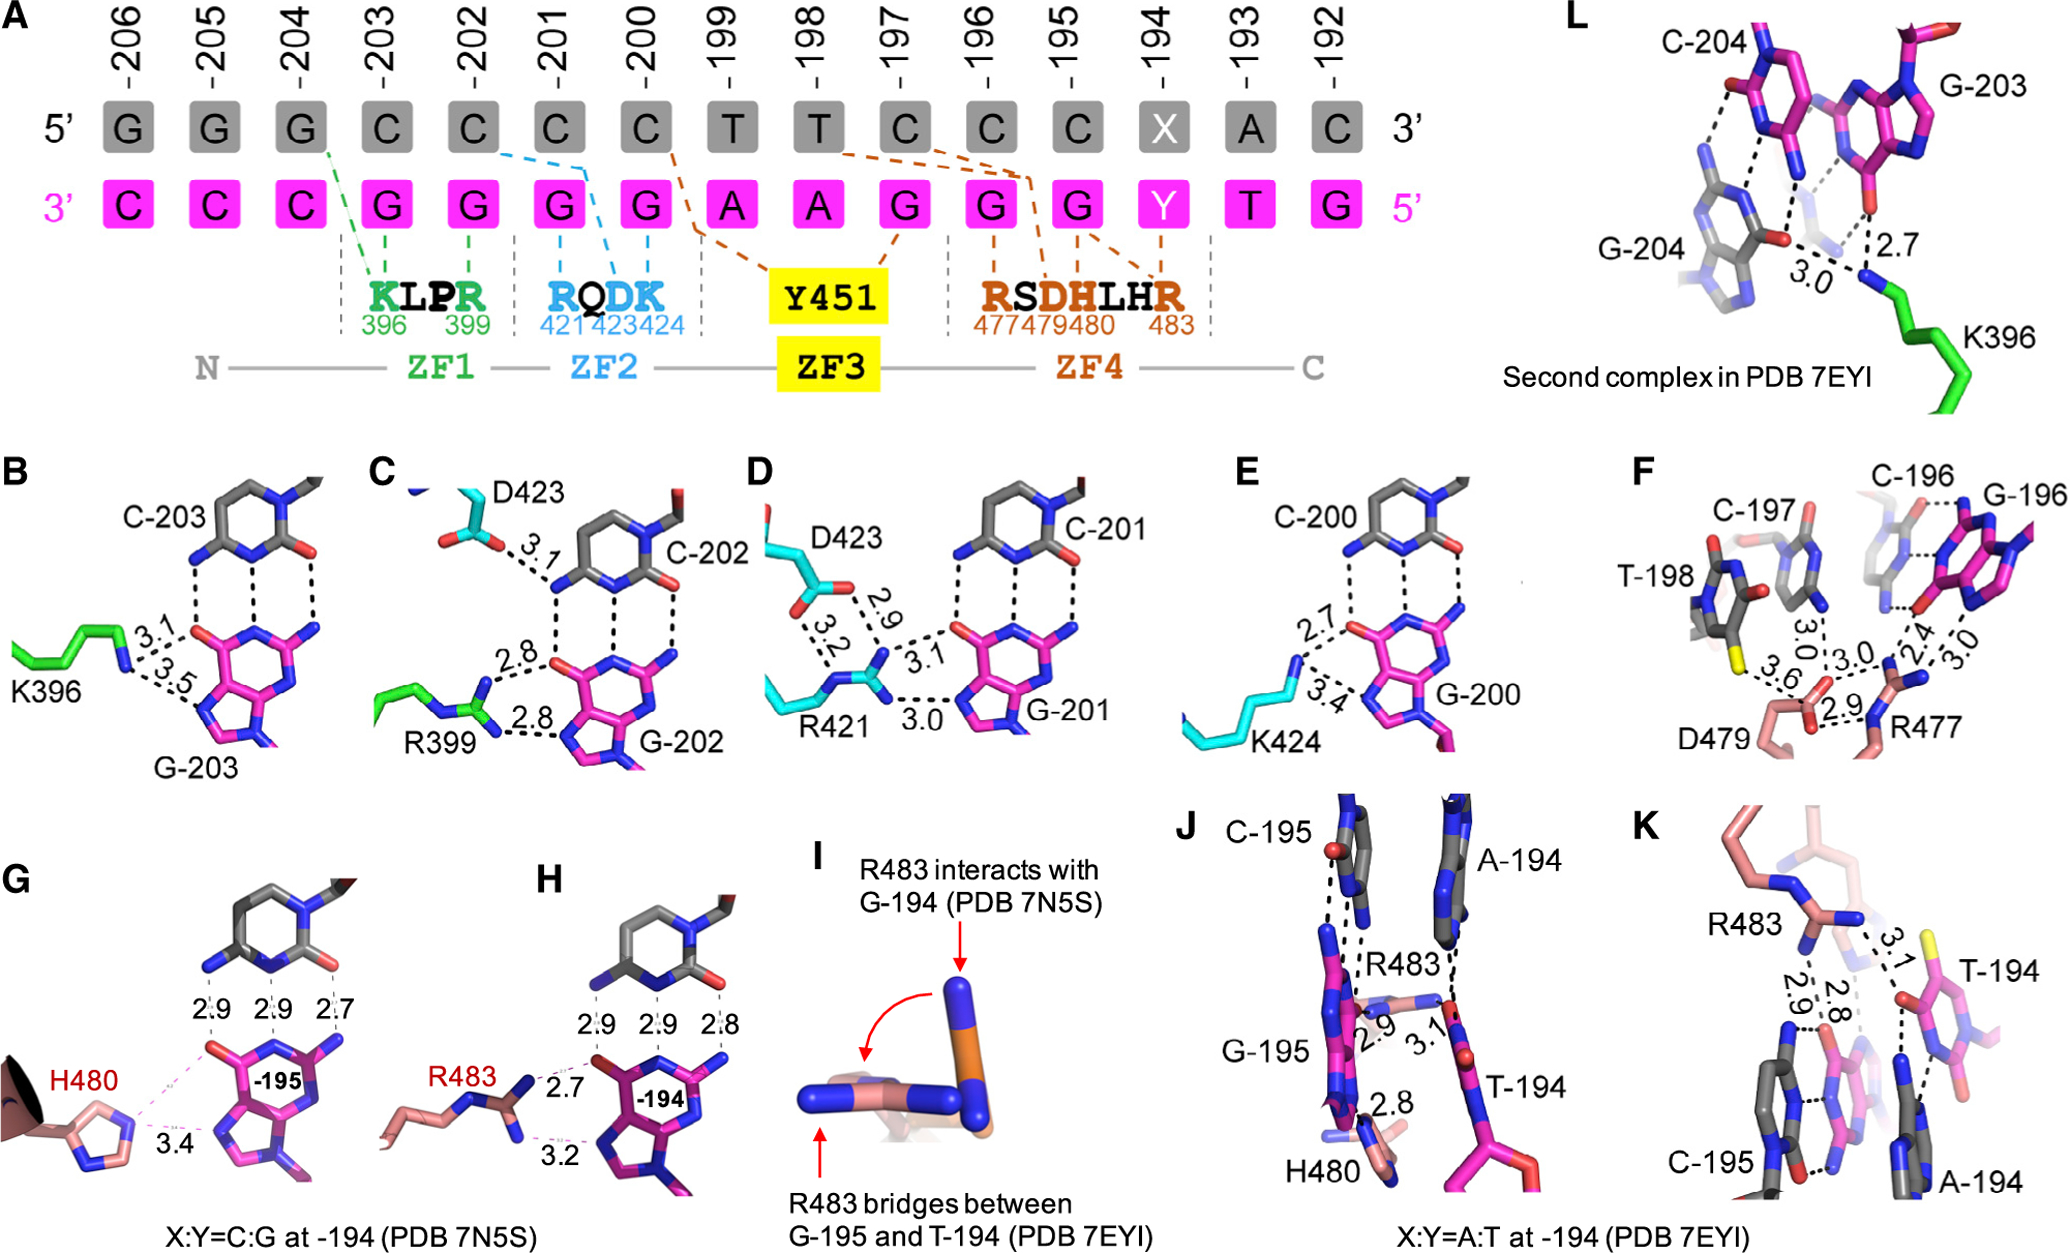
Figure 3. Details of ZBTB7A-base interactions.

(A) General scheme of interactions between ZF1–ZF4 and DNA. The top three lines indicate base pairs of the fetal globin promoter positions from −206 to −192. The amino acids from N-to-C terminus (shown in the bottom) run antiparallel with the DNA recognition strand (magenta) from 3′ to 5′. X:Y = C:G or A:T
(B–K) Examples of base-specific contacts, taken from PDB: 7EYI or otherwise as indicated. Interatomic distances are measured in angstroms.
(B) Lys396 of ZF1 interacts with G at −203.
(C) Arg399 of ZF1 and Asp423 of ZF2 interact with C:G base pair at −202.
(D) Arg421 of ZF2 interacts with G at −201.
(E) Lys424 of ZF2 interacts with G at −200.
(F) Arg477 of ZF4 interacts with G at −196. Asp479 is in contact with preceding T (at −198) and C (at −197).
(G) His480 of ZF4 interacts with G at −195.
(H) Arg483 of ZF4 interacts with G at −194.
(I) Arg483 undergoes a rotation from C:G to A:T at −194.
(J and K) When C:G at −194 is substituted by A:T, Arg483 of ZF4 bridges between the two neighboring bases T (at −194) and G (at −195). For the corresponding electron density, see Figure S1H.
(L) In the second complex of PDB: 7EYI, Lys396 of ZF1 has a strand-cross bridge between two guanines, G at −203 and G at −204. For the corresponding electron density, see Figure S1I.
