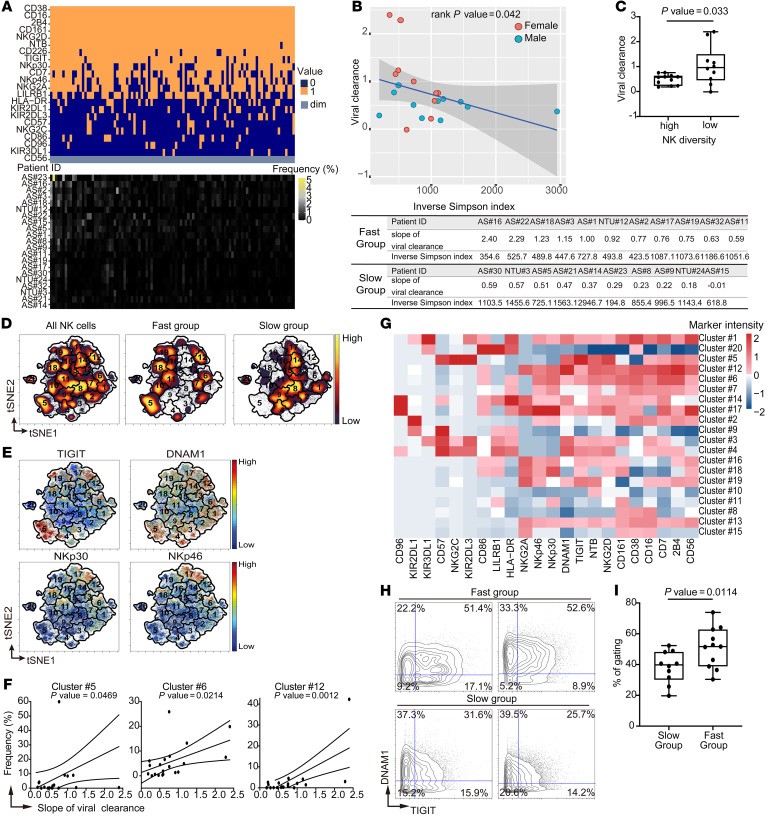
Figure 1. SARS-CoV-2 clearance rate is associated with features of NK cells.
(A) Upper: Frequencies of top 100 marker combinations from Boolean gating over the 21 patient samples. Each column represents a specific marker combination. Orange, dark blue, and light gray indicate positive (1: marker intensity higher than the threshold [CD56dim]) and negative (0: marker intensity lower than the threshold [CD56dim]) for the indicated markers and CD56dim, respectively. Lower: Frequencies of the indicated marker combinations for each patient. (B) Upper: Viral clearance rate plotted versus the inverse Simpson index of receptor repertoire diversity. Circles, individual patients. Blue, male. Red, female. Blue line, linear regression; gray shading, 95% confidence interval (rank P = 0.042). Lower: Table of slopes and inverse Simpson indices for each patient. (C) Box-and-whisker plot of slopes for each patient in high (n = 11) and low (n = 10) NK diversity groups. Maximums, 75th, 50th, 25th percentiles, and minimums are 0.757, 0.633, 0.573, 0.229, and 0.184 for the high group and 2.40, 1.50, 0.96, 0.451, and –0.012 for the low group. P = 0.033 by linear regression of the binary NK diversity coefficient. (D) Abundances of NK cells with indicated characteristics visualized in tSNE maps color coded by cell density (yellow, high; purple, low). The number indicates the cluster ID of each FlowSOM metacluster. (E) Expression levels of indicated markers visualized in tSNE maps. (F) Frequencies of indicated clusters in individual patients versus the viral clearance (P = 0.0469, 0.0214, and 0.0012, for clusters 5, 6, and 12, respectively). (G) Heatmap of median arcsinh-transformed intensities of indicated markers in each metacluster. (H) Biaxial contour plots of TIGIT and DNAM1 from patients in fast (n = 11) and slow (n = 10) clearance groups. The numbers indicate the percentage of cells in each quadrant. (I) Box-and-whisker plot of frequencies of DNAM1hiTIGIThi cells in patients from slow and fast groups. Maximums, 75th, 50th, 25th percentiles, and minimums are 52.3, 48.28, 39.80, 30.13, and 19.70 for the slow group and 73.90, 62.80, 51.70, 38.80, and 30.40 for the fast group. P = 0.0114 by 1-tailed, unpaired Student’s t test.

