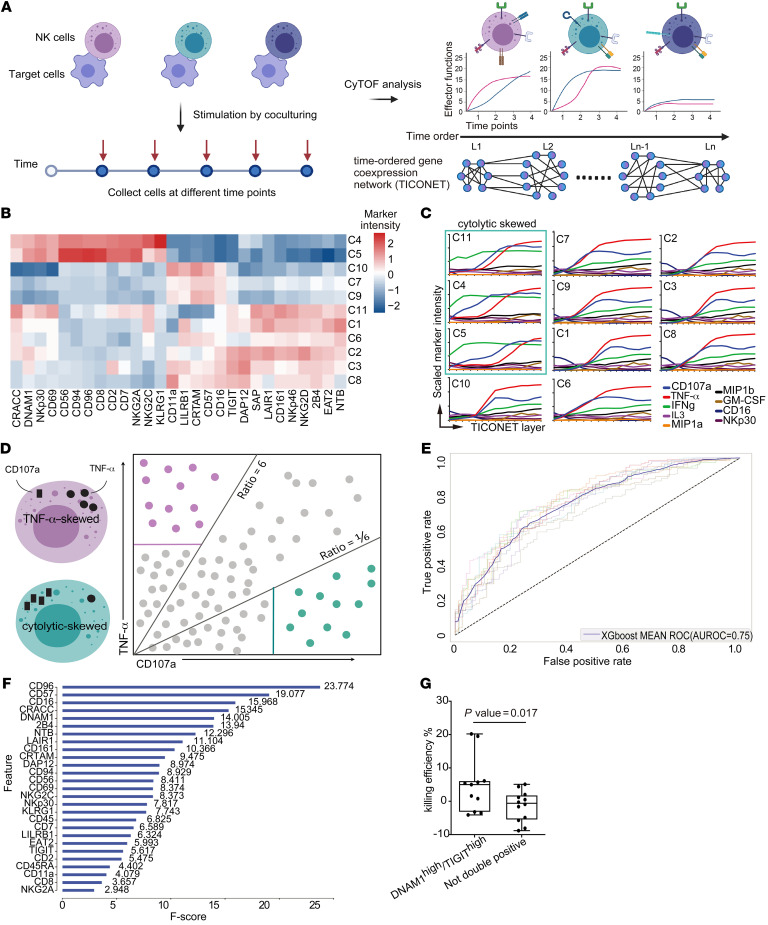
Figure 2. NK cell subsets have distinct kinetics and effector functions in response to target cell stimulation.
(A) Schematic diagram of the experiment. Primary NK cells were cocultured with 721.221 cells, and collected at different time points for immunophenotyping and intracellular functional effector staining followed by mass cytometry (CyTOF) analysis. The resultant data set was utilized to build the TICONET. The levels (L1 to Ln) in the TICONET represent the time order of coexpressed gene sets. Each TICONET starts from a cluster of 0-hour time point cells, labeled L1. Cells in the next level are the most similar to the cells in the previous level. (B) Heatmap of arcsinh-transformed marker intensities of protein expression from the 0-hour time point NK cells in clusters C1 to C11. (C) Line graphs of arcsinh-transformed intensities of the indicated markers from NK cells in each TICONET. The cytolytically skewed clusters are designated by the green box. (D) Schematic illustration of the strategy of machine learning. Purple dots represent the expression profiles of TNF-α–skewed NK cells, and green dots represent the cytolytically skewed NK cells. Purple and solid green lines indicate TNF-α– and CD107a-positive thresholds, respectively. (E) AUROC curves of XGBoost models during 10-fold cross validation. The solid curve represents the average curve of 10 ROC curves. (F) Markers in order of feature importance in the final XGBoost model trained on the entirety of selected data. F scores are indicated. (G) Box-and-whisker plot of quantification of the killing efficiency of SARS-CoV-2–infected cells by DNAM1hiTIGIThi cells (n = 11) and as not-double-positive cells (n = 12) in 2 independent experiments. Maximums, 75th, 50th, 25th percentiles, and minimums are 20.20, 6.10, 5.00, –3.20, and –4.10 for DNAM1hiTIGIThi NK cells and 5.10, 1.80, –0.60, –5.50, and –8.80 for the not-double-positive NK cells. P = 0.017 by 1-tailed, unpaired Student’s t test.

