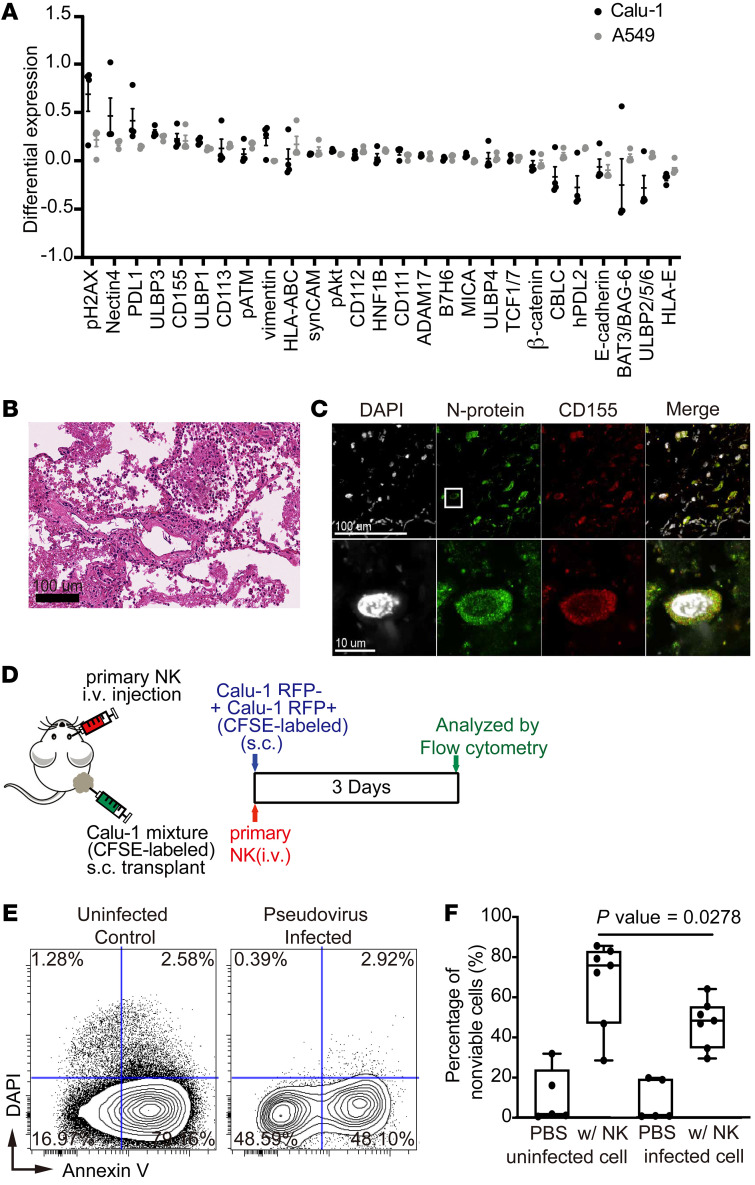
Figure 3. SARS-CoV-2 induces the expression of factors in infected cells that allow evasion of NK-mediated cytotoxicity.
(A) Dot plots of differential expression of indicated ligands induced upon infection of A549 cells (gray) and Calu-1 cells (black) with SARS-CoV-2. Differential expression was calculated by subtracting the arcsinh-transformed intensities of ligands in cells that do not express N protein from N protein–positive cells. Results were validated in 4 independent experiments (n = 4). Data represent mean ± SEM. (B) Representative image of H&E-stained lung tissue from a COVID-19 patient demonstrating organizing diffuse alveolar damage. (C) Representative immunofluorescence images of a lung tissue section from a SARS-CoV-2–infected patient stained for CD155 (red), N protein (green), and DAPI (white). The rectangle in the upper image indicates the region magnified in the lower image. (D) Schematic of the experiment used to evaluate cytotoxicity of primary NK cells against SARS-CoV-2 pseudovirus–infected cells. A mixture of infected (RFP+) and uninfected (RFP–) Calu-1 cells were labeled with CFSE and injected subcutaneously into mice on day 0. Primary NK cells were expanded and injected intravenously on the same day. Control mice were injected with PBS rather than NK cells. Calu-1 cells were analyzed by flow cytometry on day 3. (E) Representative biaxial plot of dissociated Calu-1 cells from mice treated as described in panel D stained with annexin V and DAPI. (F) Quantification of dead Calu-1 cells from 7 mice from 2 independent experiments described in panel D. Maximums, 75th, 50th, 25th percentiles, and minimums for uninfected cells in mice treated with PBS were 31.89, 23.99, 1.83, 0.90, and 0.63, respectively; for uninfected cells in mice treated with NK cells were 85.64, 83.02, 75.88, 46.94, and 28.54, respectively; for infected cells in mice treated with PBS were 19.82, 19.37, 0.93, 0.83, and 0.76, respectively; for infected cells in mice treated with NK cells were 64.12, 55,45, 48.35, 34.65, and 29.54, respectively. P = 0.0278 by Tukey’s multiple comparison test.

