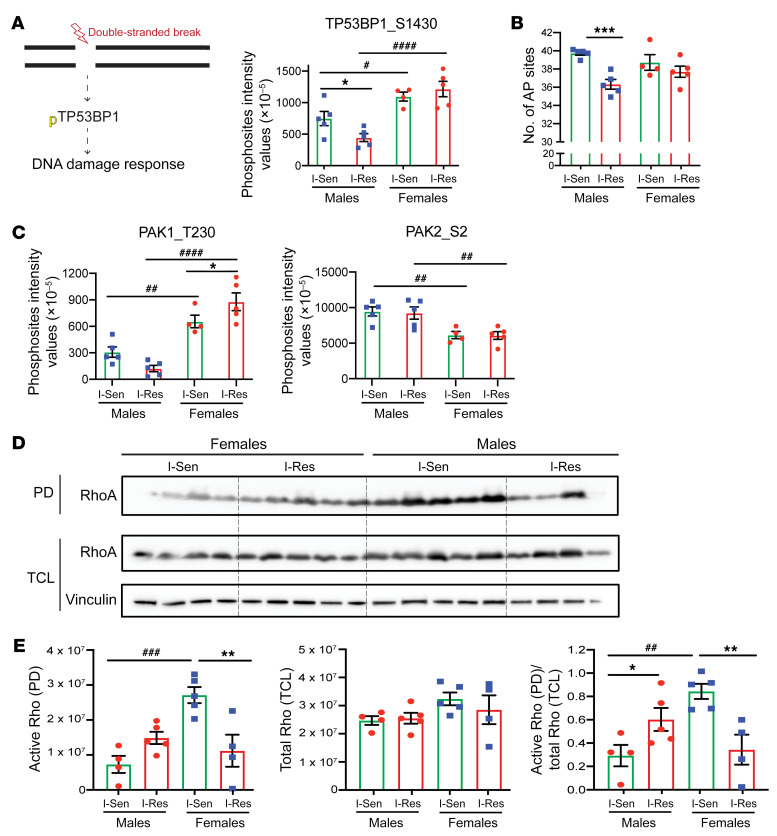
Figure 6. Functional implication of the phosphoproteomics alterations.
(A) DNA damage response overview and quantification of TP53BP1 phosphosite. Data are represented as mean ± SEM of the basal phosphosites intensity values (×10–5). *P < 0.05, I-Sen vs. I-Res. #P < 0.05; ####P < 0.0001, men vs. women, 1-way ANOVA followed by correction for multiple comparison by controlling the FDR. (B) Quantification of the number of AP sites for equal amounts of each of the DNA samples from iMyos as per manufacturer’s instructions for ELISA. Data are represented as mean ± SEM. ***P < 0.001, I-Sen vs. I-Res, 1-way ANOVA followed by correction for multiple comparison by controlling the FDR. (C) Quantification of PAK1 and PAK2 phosphosites. Data are represented as mean ± SEM of the basal phosphosites intensity values (×10–5). *P < 0.05, I-Sen vs. I-Res. ##P < 0.01; ####P < 0.0001, men vs. women, 1-way ANOVA, followed by correction for multiple comparison by controlling the FDR. (D) Western blot of the I-Sen and I-Res iMyos from cell lysates from women and men processed through the active RhoA pull-down (PD) experiment and the total cell lysates (TCL). (E) Quantification of the raw pull-down Western blot showing active form of RhoA as well as total cell lysates showing total RhoA levels. Vinculin is used as a loading control. Data are represented as mean ± SEM. *P < 0.05; **P < 0.01, I-Sen vs. I-Res. ##P < 0.01; ###P < 0.001, men vs. women, 1-way ANOVA, followed by correction for multiple comparison by controlling the FDR.

