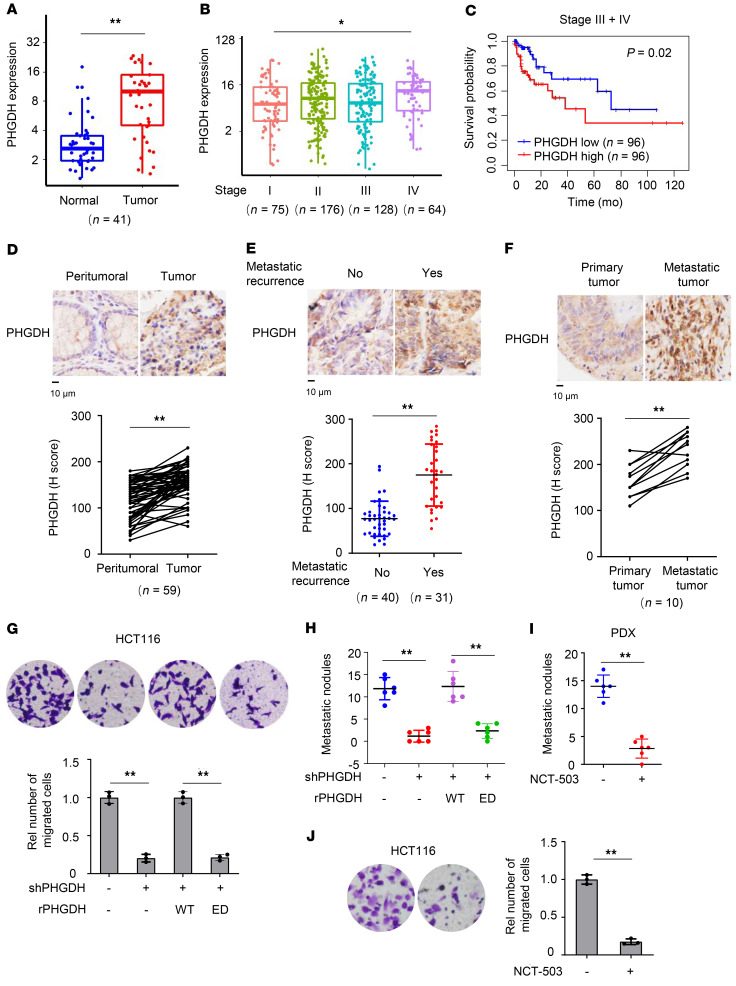
Figure 1. PHGDH activity is important for CRC metastasis.
(A–C) TCGA RNA-sequencing data of patients with colon adenocarcinoma were analyzed. PHGDH mRNA levels were compared between tumors and paired normal tissues (A) or between different stages (B) (Wilcoxon’s signed-rank test). The boxes represent the median and the first and third quartiles, and the whiskers represent the minimum and maximum of all data points. Survival durations of 192 patients with low or high expression of PHGDH were compared (Kaplan-Meier method, C). (D–F) IHC analyses of PHGDH were performed in tumors and paired peritumoral tissues (D), primary tumors with or without metastatic recurrence (E), or paired primary tumors and metastatic tumors in the livers (F) from patients with CRC. Top, representative IHC staining images. Bottom, semiquantitative scoring (H score). D and F, paired t test, 2 tailed. E, Data represent mean ± SD (2-tailed t test). (G and H) HCT116 cells stably expressing shNT or PHGDH were infected with the lentivirus expressing rPHGDH WT or ED. Transwell migration assays were performed (G). Representative images (top) and statistical analyses (bottom) of the migrated cells were shown. Data represent mean ± SD of 3 biologically independent experiments. The cells were injected into spleens of randomized BALB/c nude mice. The metastatic nodules in the livers were counted and statistically analyzed (H). Data represent mean ± SD of 6 mice. One-way ANOVA with Tukey’s multiple-comparison test. Rel, relative. (I) Metastatic tumors were dissected from patients with CRC with hepatic metastasis and subcutaneously implanted into randomized BALB/c nude mice. Mice were treated with or without NCT-503. Metastatic nodules in the livers were counted and statistically analyzed. Data represent the mean ± SD of 6 mice (2-tailed t test). (J) Transwell migration assays were performed in HCT116 cells treated with or without 10 μM NCT-503. Data represent the mean ± SD of 3 biologically independent experiments (2-tailed t test). *P < 0.05, **P < 0.01. See also Supplemental Figure 1.

