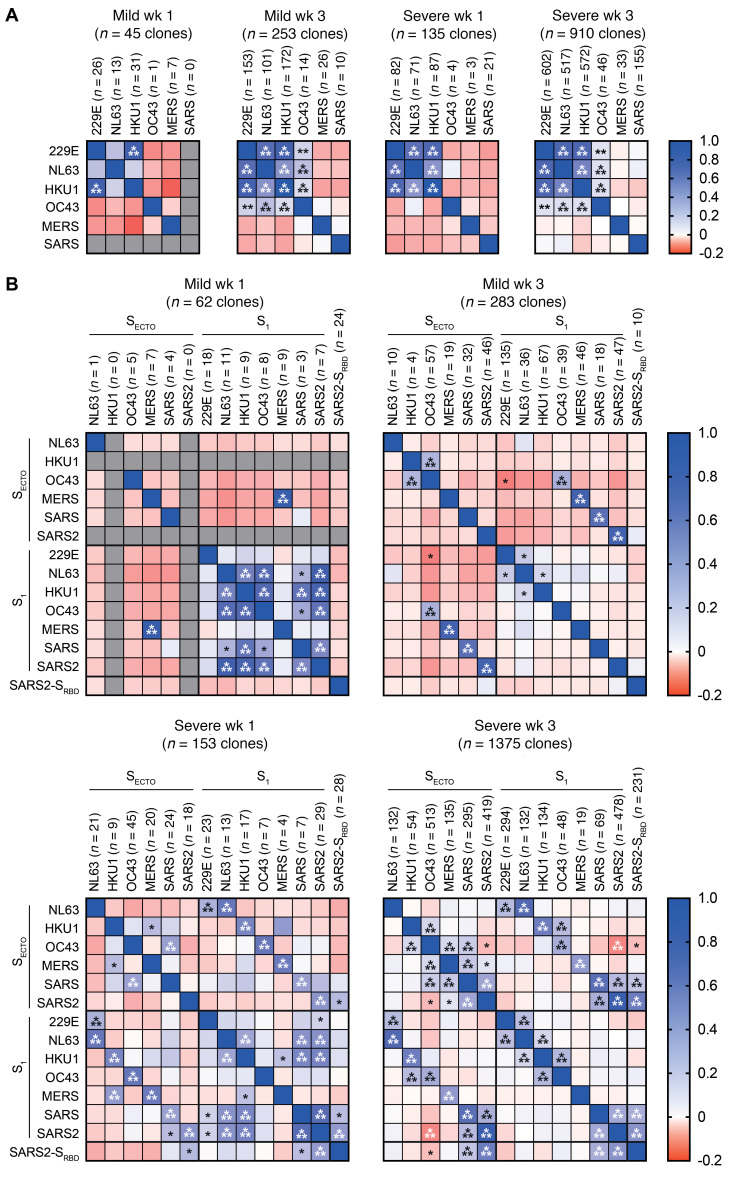
Figure 4. Combined analysis of reactive IgG clones from patients with mild or severe COVID-19 shows major differences in cross-reactivity patterns.
Pearson’s correlation analysis of (A) N- and (B) S-reactive IgG clones identified in patients with mild COVID-19 (n = 6) in week 1 and week 3 after the onset of symptoms, and in patients with severe COVID-19 in week 1 (n = 3) and week 3 (n = 11) after the onset of symptoms. Heatmaps show the R value of Pearson’s regression (red to blue shades, range –0.2–1) and the significant P value (*P < 0.05, **P < 0.01, and ***P < 0.001) of these correlations.

