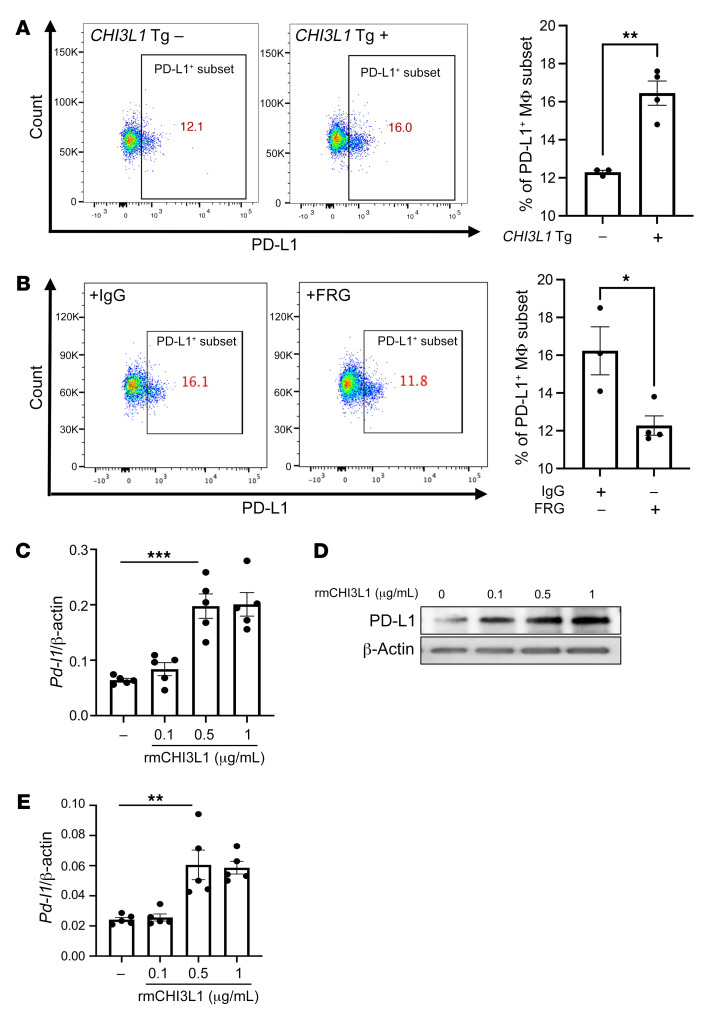
Figure 5. CHI3L1 stimulates pulmonary macrophage PD-L1.
Eight-week-old WT (–) and CHI3L1-transgenic (+) mice were used to evaluate macrophage-lineage cell PD-L1 in the lung. (A) FACS evaluations comparing PD-L1 on CD11b+ cells isolated from lungs from WT versus CHI3L1-transgenic mice. (B) FACS evaluations comparing PD-L1 on CD68+ cells isolated from lungs from WT mice treated with anti-CHI3L1 antibody (FRG) or its isotype control. (C) RT-PCR was used to quantitate the levels of mRNA encoding PD-L1 in bone marrow–derived macrophages from WT mice that were treated in vitro with recombinant murine (rm) CHI3L1 or vehicle control. Each dot represents an evaluation performed using cells from an individual animal. (D) Western blot evaluations of PD-L1 accumulation in bone marrow–derived macrophages from WT mice treated with the noted concentrations of rmCHI3L1 or vehicle control in vitro. (E) RT-PCR was used to quantitate the levels of mRNA encoding PD-L2 in bone marrow–derived macrophages from WT mice after stimulation with the noted concentrations of rmCHI3L1 (μg/mL) or vehicle control in vitro. Each dot represents an evaluation performed using cells from an individual animal. D is representative of a minimum of 2 similar evaluations. The values in C and E represent the mean ± SEM of the noted evaluations represented by the individual dots. *P < 0.05, **P < 0.01, ***P < 0.001 (A and B, Student’s t test; C and E, 1-way ANOVA with Tukey’s post hoc test).

