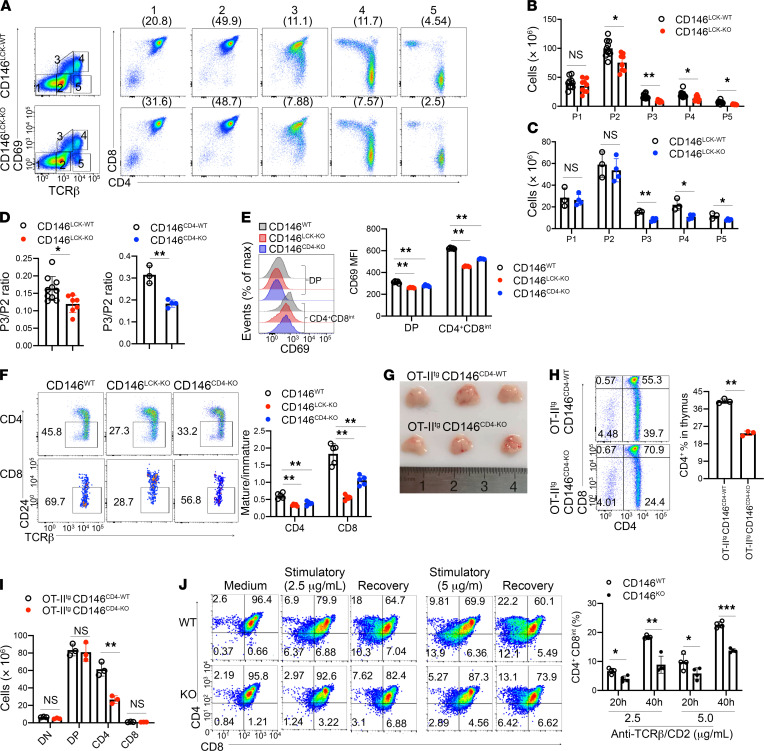
Figure 3. CD146 is required for positive selection.
(A) Surface staining of CD69 and TCRβ on thymocytes from CD146LCK-WT and CD146LCK-KO mice. Numbers in outlined areas on the left indicate subpopulations gated, which are further analyzed and shown individually on the right, and numbers in parentheses above plots on the right indicate percent thymocytes in each subpopulation. (B and C) The numbers in subpopulations 1–5 of CD146LCK-WT (n = 10) and CD146LCK-KO (n = 7) (B) or CD146CD4-WT (n = 3) and CD146CD4-KO (n = 4) mice (C). (D) Ratio of subpopulation 3 to 2 from CD146WT, CD146LCK-KO, or CD146CD4-KO mice. (E) Left: Surface staining of CD69 on gated CD4+CD8int and DP thymocytes from WT, CD146LCK-KO, or CD146CD4-KO mice. Right: Quantification of CD69 MFI (n = 5). (F) Left: Surface staining of CD24 and TCRβ in CD4+ (top) or CD8+ (bottom) thymocytes from CD146WT, CD146LCK-KO, or CD146CD4-KO mice. The outlined areas indicate mature cells (CD24neg–loTCRβ+). Right: The ratio of mature (CD24neg–lo) to immature (CD24hi) cells among CD4+ or CD8+ cells from WT, CD146LCK-KO, or CD146CD4-KO mice (n = 5). (G) Thymuses from OT-IItgCD146CD4-WT and OT-IItgCD146CD4-KO mice (representative of n = 3). (H) Left: Surface staining of CD4 and CD8 on thymocytes from OT-IItgCD146CD4-WT and OT-IItgCD146CD4-KO mice. Right: Percentage of CD4+ thymocytes. (I) Cell numbers of DN, DP, CD4+, and CD8+ subpopulations (n = 3). (J) Left: Surface staining of CD4 and CD8 on sorted and developmental DP cells from WT and KO mice. Right: Percentages of CD4+CD8int cells among DP cells stimulated as described (n = 4). Each symbol represents an individual mouse; the short horizontal lines indicate the mean ± SEM. One-way ANOVA followed by Bonferroni’s correction (B, C, E, F, I, and J) or 2-tailed t test (D and H) was performed. *P < 0.05, **P < 0.01, ***P < 0.001.

