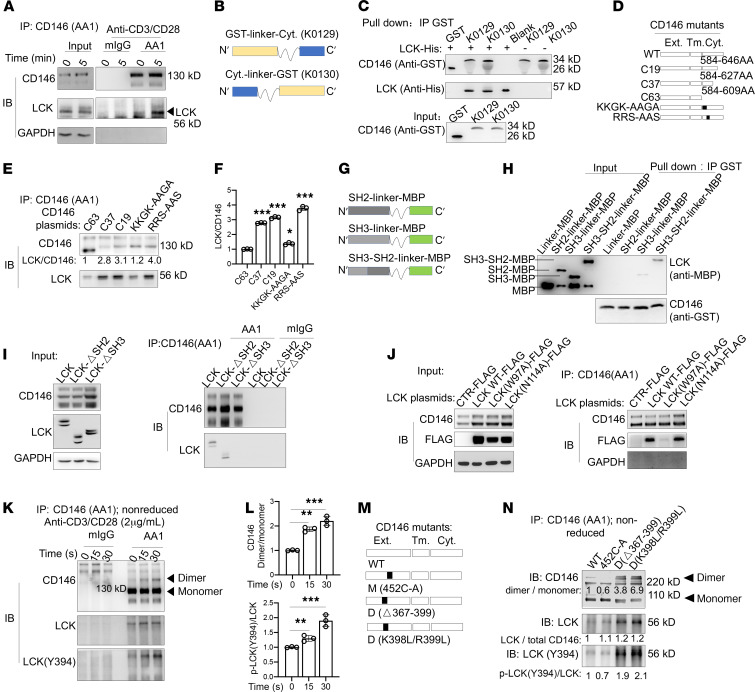
Figure 7. CD146 interacts with LCK, and its dimerization promotes LCK activation.
(A) Immunoblot (IB) analysis of CD146 and LCK in Jurkat cells immunoprecipitated (IP) with anti-CD146 (AA1) or isotype IgG stimulated for the times indicated. (B) Schematic representations of recombinant CD146 intracellular proteins. (C) Pull-down assay of recombinant CD146 intracellular proteins and LCK-His protein. (D) Schematic representations of CD146 intracellular mutants. (E) IP with AA1 to detect the interaction of CD146 intracellular mutants and LCK in 293T cells. (F) Quantification of the LCK to CD146 ratio (n = 3). (G) Schematic representation of the SH2, SH3, and SH3-SH2 domains of LCK. (H) Pull-down assay of recombinant CD146 intracellular proteins and LCK domain–MBP protein. (I) IB analysis of CD146 and LCK in 293T cells transfected with LCK or LCK-deletion SH2 or SH3 domain plasmid and then immunoprecipitated with anti-CD146 (AA1) or isotype IgG. (J) IB analysis of CD146 and FLAG in 293T cells transfected with FLAG-LCK mutant plasmid and then immunoprecipitated with anti-CD146 (AA1). (K) IB analysis of CD146 dimer and LCK in Jurkat cells immunoprecipitated with anti-CD146 (AA1) or isotype IgG upon anti–CD3/CD28 stimulation for the times indicated. Arrowheads indicate the corresponding proteins. (L) Relative ratio of either CD146 dimer to monomer or LCK(Y394) to total LCK (n = 3). (M) Schematic representation of the CD146 monomer, WT, and dimer mutants. (N) IB of LCK and LCK(Y394) in 293T cells transfected with CD146 monomer, WT, or dimer and LCK plasmids and immunoprecipitated with anti-CD146 (AA1). The number below each band represents the relative ratio to WT. Each symbol represents 1 experiment. One-way ANOVA followed by Bonferroni’s correction (F and L) was performed. Data are representative of 3 independent experiments. Data are shown as the mean ± SEM. *P < 0.05, **P < 0.01, ***P < 0.001. ext., extracellular; tm., transmembrane; cyt., cytoplasmic.

