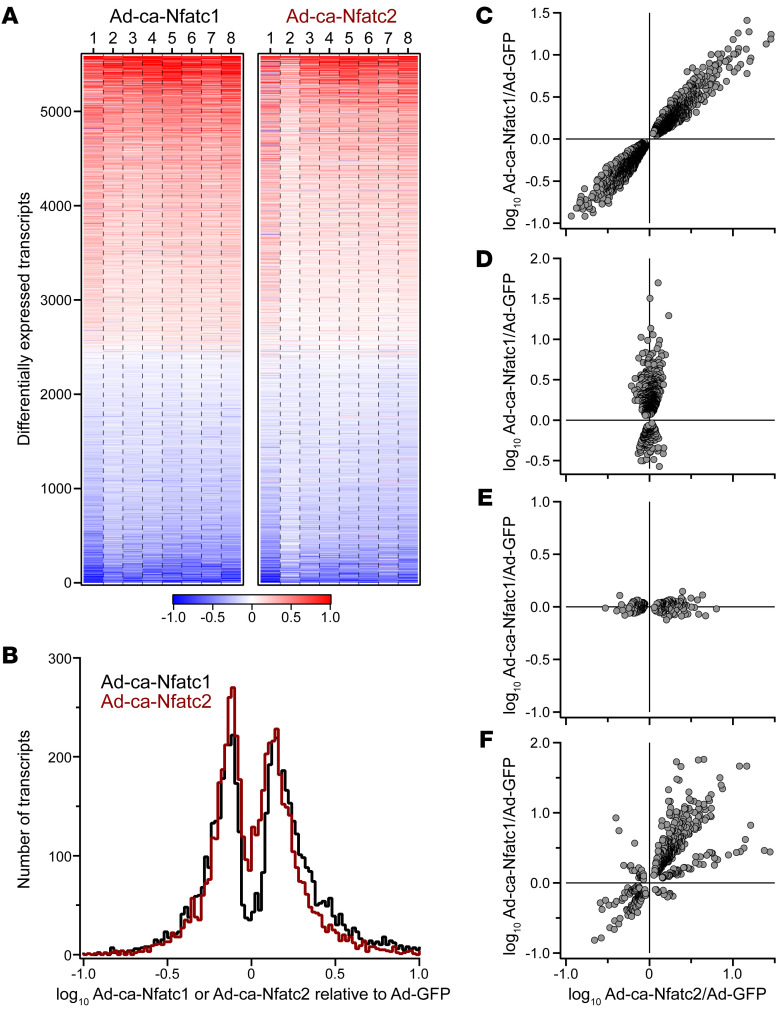
Figure 1. NFATC1 and NFATC2 regulate gene expression in human islets.
Whole-islet RNA was sequenced from 8 separate human donors (donors 1–8) 48 hours after Ad-mediated expression of CA Nfatc1 or Nfatc2; Ad-GFP was used as the negative control. (A) Heatmap shows the expression of transcripts among the individual samples that were differentially regulated in response to NFATC1 and/or NFATC2 relative to GFP (5589 transcripts). Transcripts are ordered by the average increase in expression in response to NFATC2. Red, increased expression; blue, decreased. A small number of transcripts showed a greater than 10-fold change in expression. For illustration purposes, z scale for heatmap is truncated at a 10-fold change. A complete list of all transcripts and their regulation by NFATC1 and NFATC2 is provided in Supplemental Table 1. (B) Distribution of log10 fold-change in expression for NFATC1- and NFATC2-regulated transcripts. Transcripts were further classified as those that were regulated equally in response to NFATC1 and NFATC2 (C, 3141 transcripts), regulated by NFATC1 only (D, 794 transcripts), regulated by NFATC2 only (E, 226 transcripts), or differentially regulated by NFATC1 and NFATC2 in magnitude or direction (F, 631 transcripts).

