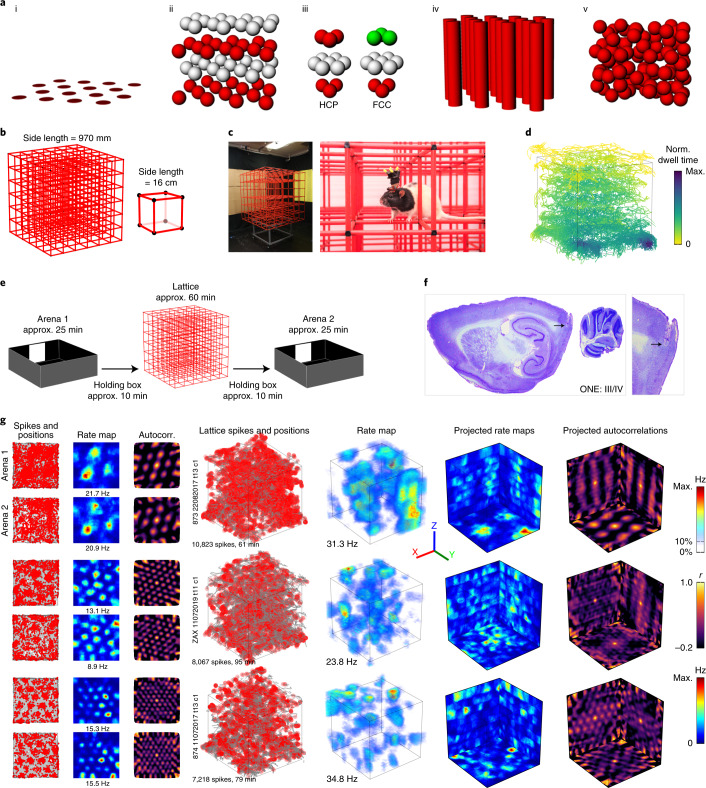
Fig. 1. Grid cells produced firing fields in a 3D climbing lattice.
a, Hypothetical grid field packings: standard horizontal hexagonal field configuration (i); exploded close-packed lattice, in this case HCP (layers color coded for clarity) (ii); units of the two optimal packings: HCP (left) alternates two layer-arrangements whereas FCC (right) has three (iii); columnar field configuration (iv); and random field configuration (v). b, Lattice maze schematic. c, Lattice maze photographs. See Extended Data Fig. 1a for arena photographs. d, Example coverage in a lattice session. Color denotes normalized (Norm.) dwell time in each region. e, Recording protocol. f, Example histology. Data for all animals can be seen in Supplementary Fig. 2. g, Three representative grid cells in the arenas (left) and lattice (right). Left–right: arena spike plots (gray shows coverage; red dots show spikes), arena rate maps, arena autocorrelations, volumetric spike plots, volumetric firing rate maps, rate maps as projected on to each of the three coordinate planes and projected autocorrelations. Color bars from top to bottom correspond to volumetric rate maps, autocorrelations and planar rate maps. All grid cells can be seen in Supplementary Fig. 1.

