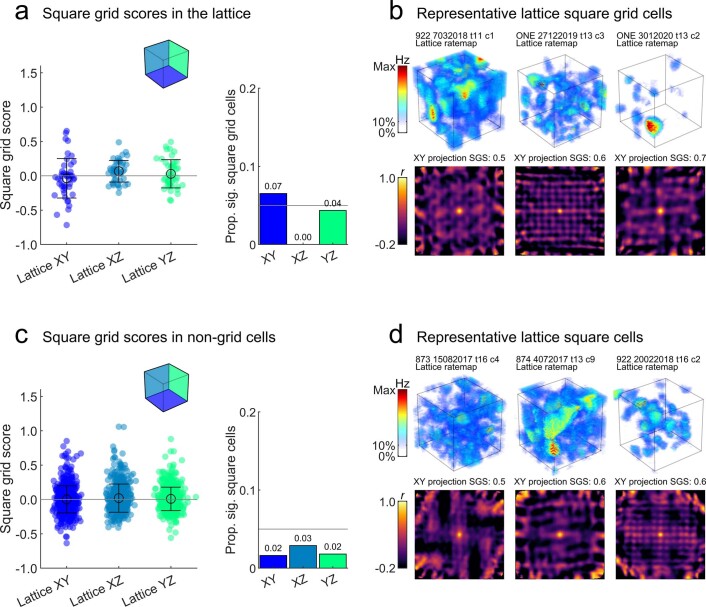
Extended Data Fig. 6. Weak evidence of square pattern activity in grid cells and non-grid cells.
For panels a & c: Filled markers represent cells, open circles denote mean, error bars denote SEM. (a) Left) square grid scores for all grid cells (n=46) in each projected plane of the lattice maze. Square grid scores are low in each of the lattice planes and these did not differ (F(2,135) = 2.5, p = .0872, η2 = 0.036, one-way ANOVA). Right) proportion of grid cells with a square grid score exceeding the 95th percentile of a chance distribution in each lattice plane. A small number of cells exhibited a significant square firing pattern when projected onto the XY and YZ planes. Grey line shows the value that would be expected by chance (5%). (b) Three examples of these significant XY square grid cells. Top row shows the volumetric firing rate map, text gives the rat number, date, tetrode and cluster. Bottom row shows the autocorrelation of the XY projected firing rate map, text gives the square grid score (SGS) of the autocorrelation. (c-d) same as a-b but for all non-grid cells (n=550, 551 & 550). Square grid scores were again low and did not differ between projected planes (F(2,1648) = 1.2, p = .2975, η2 = 0.0015, one-way ANOVA). No plane exhibited more square grid cells than would be expected by chance (5%, grey line).

