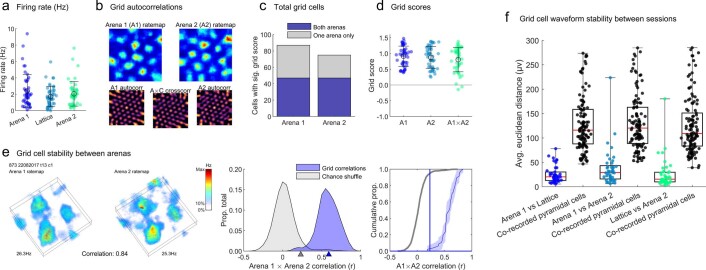
Extended Data Fig. 2. Grid cells were more stable than chance throughout recordings.
For panels A, D, E & F: n=47 cells. For panels a & d: filled markers represent cells, open circles denote mean, error bars denote SEM. (a) Grid cell firing rates did not differ between the mazes (F(2,138) = 2.0, p = .135, η2 = 0.029, one-way ANOVA). (b) Example grid cell ratemaps and autocorrelations for the two arena sessions. In addition to ratemap autocorrelations we also calculated the cross-correlation between arenas 1 and 2. Only cells with a grid score exceeding the 95th percentile of a shuffle in both arena sessions were analysed. (c) Total number of cells with a grid score exceeding the 95th percentile of a shuffle in each arena session. The purple bar sections represent the cells categorised as grid cells and included in the main analyses, grey bars represent unstable cells that met our grid cell criteria in only one arena session. Main results were also replicated using only these unstable grid cells (Extended Data Fig. 5). (d) Grid scores of all grid cells calculated for both arenas and the cross-correlation between arena maps. These scores did not differ (F(2,138) = 1.1, p = .337, η2 = 0.016, one-way ANOVA). (e) Left) example firing of a grid cell in both arenas. Middle) to determine if grid cells were stable between arenas we correlated their arena firing rate maps (blue area; blue triangle denotes median) and compared this distribution to correlations between 5000 shuffled ratemaps (grey area; grey triangle denotes 95th percentile). Right) cumulative density curves of the same distributions. Shaded areas denote 95% confidence intervals. The blue vertical line marks the 95th percentile of the shuffle on the x-axis and the blue horizontal line (very close to the x-axis) marks the y-intercept of the observed correlation distribution with this. Grid cells were more stable than chance (shuffled arena correlations 95th percentile: 0.23, grid cell median correlation: 0.59, D = 0.96, p < .001, two-sample Kolmogorov-Smirnov test). (f) The Euclidean distance between waveforms in different session pairs for all grid cells (Methods: Waveform stability). Red horizontal lines denote medians; black horizontal lines denote 1st and 3rd quantiles, error bars denote data range. Distances did not change across recordings (F(2,124) = 2.6, p = .0787; one-way ANOVA) suggesting grid cells were stably recorded throughout the experiment. Although distances were smallest when comparing the lattice to each arena (Group average Lattice vs Arena 1: 25.4, Lattice vs Arena 2: 25.5, Arena 1 vs Arena 2: 38.1) which is consistent with a gradual decrease in stability over time. In each case the distances between recording pairs were also significantly lower than chance which was estimated using pyramidal cell pairs co-recorded on the same tetrodes (p < .0001 in all cases, two-sample t-tests; black distributions).

