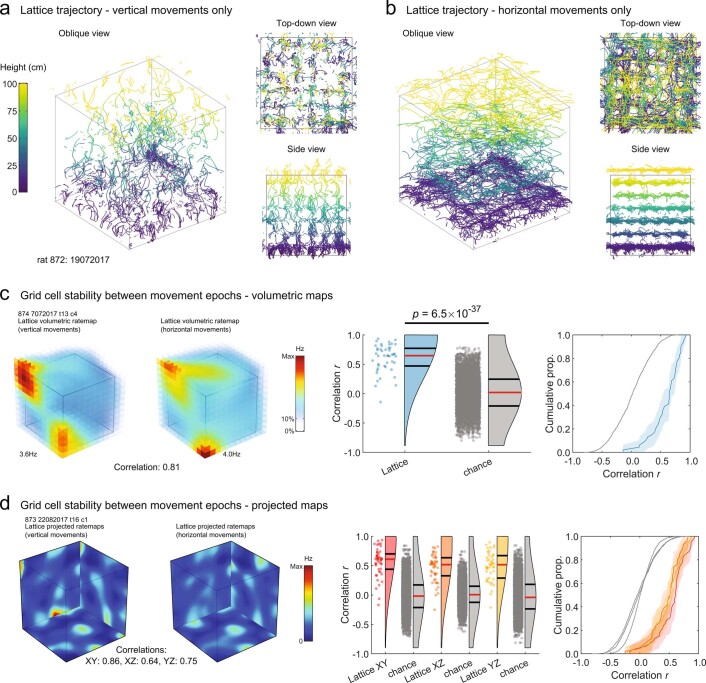
Extended Data Fig. 4. Grid cells did not remap according to movement direction.
See Methods: Stability between movement epochs. For panels c & d: n=47 cells. (a) An example lattice trajectory filtered to show only vertical movements. (b) Same as a but for horizontal movements. (c) Left) example grid cell volumetric firing rate maps used for the movement direction analysis; each map represents the same grid cell activity filtered for vertical (left) or horizontal (right) movement epochs. Note that these maps have much larger voxels than ones used or shown elsewhere. Middle) raincloud plots showing the distribution of correlation values found for grid cells in the lattice (blue) and between random grid cells (grey). Red lines denote medians, black lines denote 1st and 3rd quantiles. Right) cumulative distribution functions of the same distributions. Shaded areas denote 95% confidence intervals. Grid cells were more stable than chance (t(4834) = 12.8, p = 6.49 × 10−37; two-sample t-test). (d) Left) example grid cell projected maps used for planar correlations. Middle) raincloud plots as in a, showing the correlations found for each projected plane of the lattice for all grid cells. Right) cumulative distribution functions of these data. Shaded areas denote 95% confidence intervals. All projections were more stable than chance (p < .0001 in all cases; two-sample t-tests) and they did not differ (F(2,135) = 2.1, p = .1249, η2 = 0.0303; one-way ANOVA).

