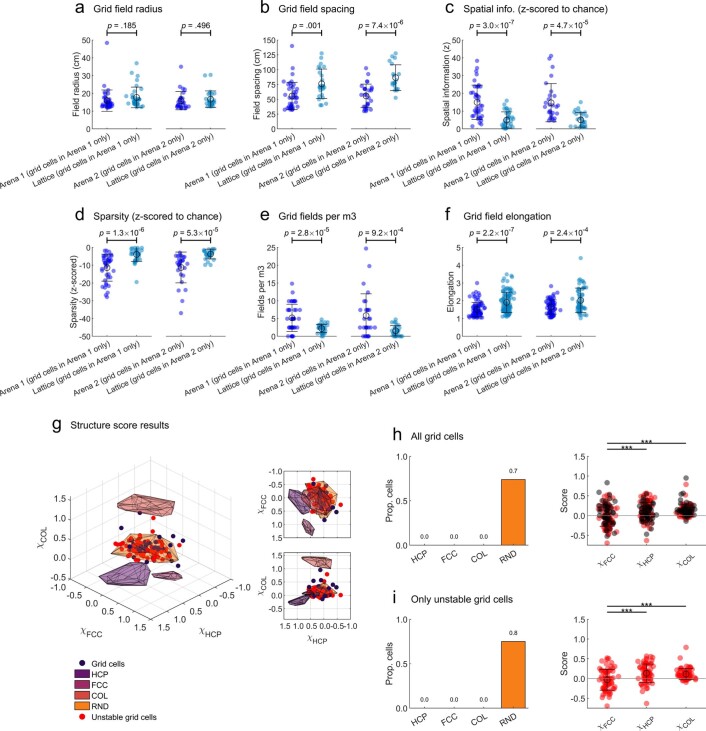
Extended Data Fig. 5. Main results were similar in unstable grid cells.
These plots supplement main figures but focus on unstable grid cells (that is cells that met our grid cell criteria in only one arena session; grey areas in Extended Data Fig. 2c). For panels a-f, h (right) & i (right): open circles denote mean, error bars denote SEM and text gives the results of one-way ANOVAs. For multiple comparisons: *** = p < .001, ** = p < .01, ** = p < .05, all two-sided tests with Dunn-Sidak correction. (a) Supplement to Fig. 2g; Grid field radius was similar in the lattice and arena sessions. n=40, 35, 28 & 27 cells. (b) Supplement to Fig. 2i; grid spacing was significantly larger in the lattice. n=40, 25, 28 & 20 cells. (c) Supplement to Fig. 2b; Z-scored spatial information was higher than chance in all environments but reduced in the lattice. n=40, 36, 28 & 28 cells. (d) Z-scored sparsity was also lower than chance in all environments but was higher in the lattice. n=40, 36, 28 & 28 cells. (e) Supplement to Fig. 2f; grid cells exhibited significantly fewer fields per m3 in the lattice maze. n=76, 82, 68 & 74 cells. (f) Supplement to Fig. 4a; fields were significantly more elongated in the lattice. n=157, 233, 166 & 188 cells. (g) Supplement to Fig. 3a; structure scores (χFCC, χHCP and χCOL) for grid cells (n=47, black markers), unstable grid cells (n=68, red markers) and simulations (convex hulls shown as shaded polygons). (h) Left) Supplement to Fig. 3c; All grid cells (stable & unstable) categorized based on which convex hull they fell into. Right) configuration specific scores for stable (n=47, black markers) and unstable (n=68, red markers) grid cells. (i) Left) Supplement to Fig. 3c; unstable grid cells categorized based on which convex hull they fell into. Right) configuration specific scores for unstable grid cells (n=68) only.

