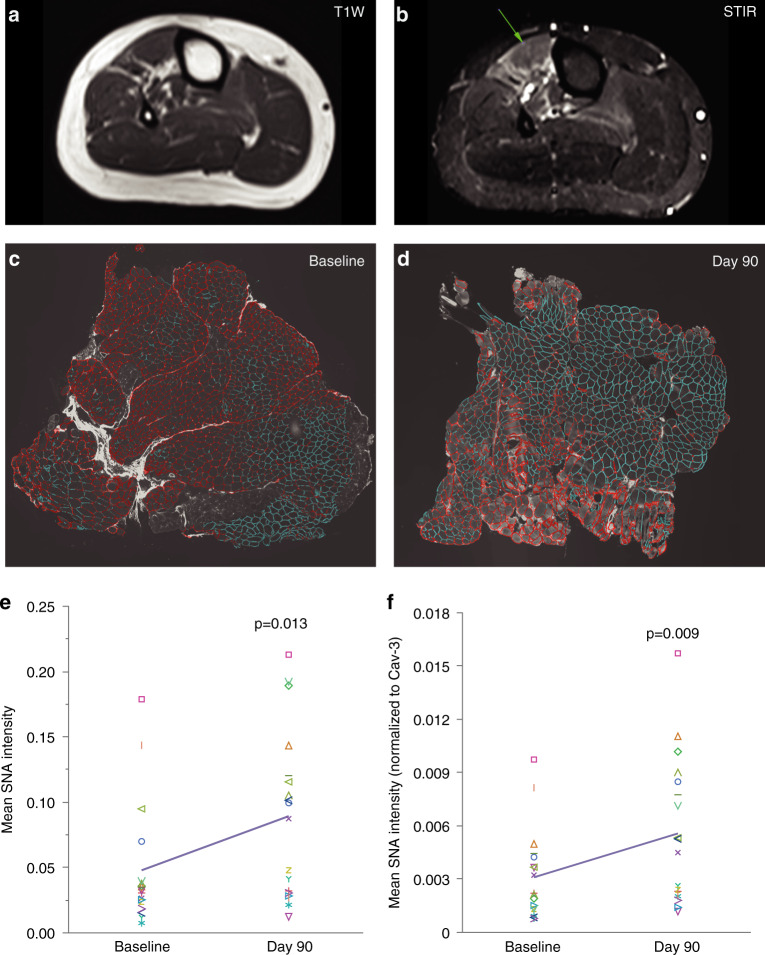
Fig. 3. Sarcolemmal sialylation.
(a, b) Selection of muscle biopsy sites by muscle magnetic resonance image (MRI) in lower extremity muscles. Muscle regions with active disease (arrow) were identified by (a) absence of significant fat replacement on T1-weighted (T1W) and (b) short tau inversion recovery (STIR) hyperintensity (arrow). (c, d) Staining of muscle cryosections with the sarcolemmal marker Caveolin-3 (Cav-3, red) and the SNA lectin that recognizes sialylation (green-blue) at (c) baseline and (d) following 90 days of daily ManNAc administration. (e, f) Sarcolemmal sialylation increased at day 90 compared to baseline as measured by (e) mean and (f) normalized SNA intensities. Each symbol represents a muscle biopsy pair at baseline and day 90 (n = 18), and the line connects the means of both timepoints.

