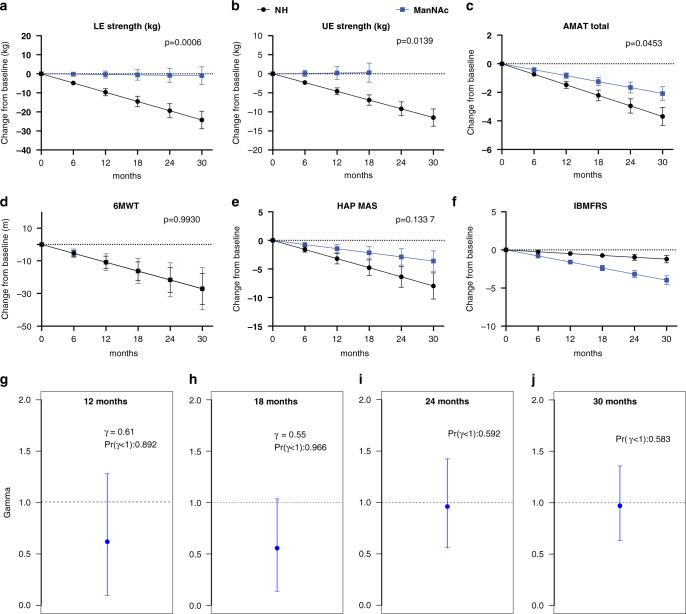
Fig. 4. Clinical efficacy of ManNAc.
(a–f) Clinical efficacy evaluated as the estimated decline for various exploratory clinical efficacy measures in patients with GNE myopathy treated with ManNAc (blue) compared with previously reported natural history (NH) estimates (black), including for (a) lower extremity (LE) strength, (b) upper extremity (UE) strength, (c) Adult Myopathy Assessment Tool (AMAT) total score, (d) 6-minute walk test (6MWT), (e) human activity profile maximum activity score (HAP MAS) and (f) Inclusion Body Myositis Functional Rating Scale (IBMFRS). (g–j) Posterior distribution of treatment effect as estimated by the GNE Myopathy Disease Progression Model (GNE-DPM) at (g) 12 months, (h) 18 months, (i) 24 months, and (j) 30 months, showing the posterior mean (blue marker) with 95% confidence intervals (blue line) of the treatment effect parameter (gamma, γ), and the posterior probability that ManNAc decreased disease progression [Pr(γ < 1)].

